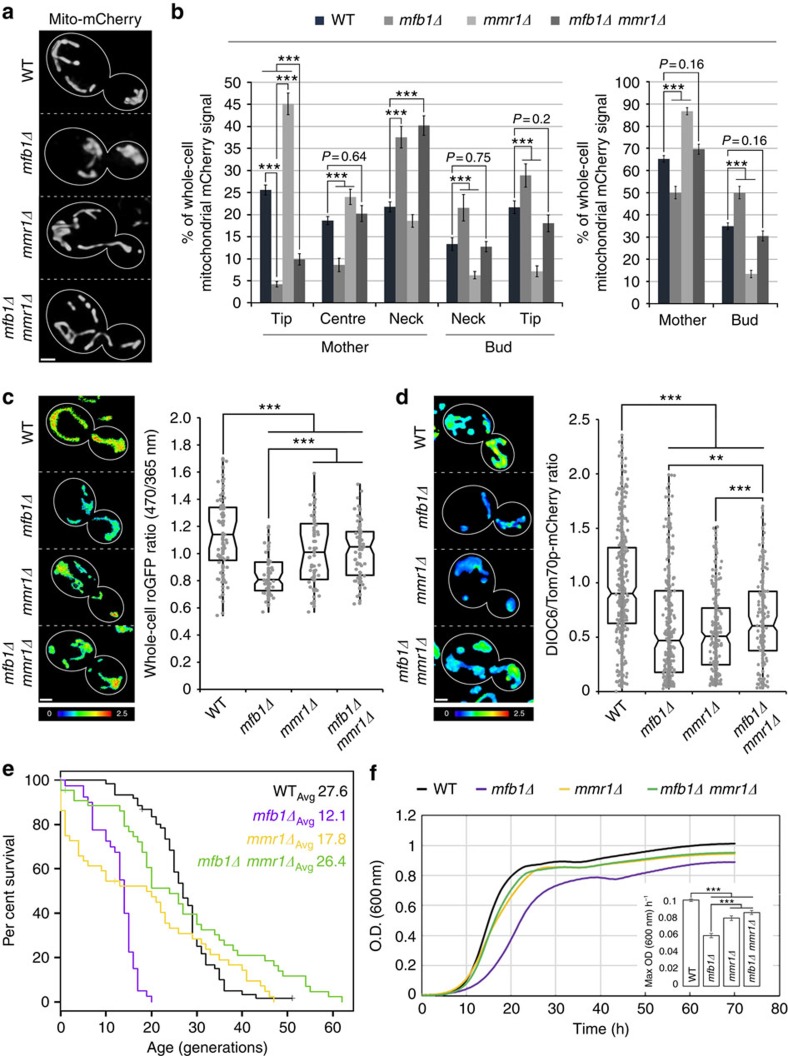
Figure 4. Deletion of MMR1 rescues defects in mitochondrial inheritance and restores cellular fitness in mfb1Δ cells.
(a,b) Cells expressing Cit1p-mCherry were grown to mid-log phase and visualized by fluorescence microscopy. (a) Representative 3D renderings of wild-type (WT), mfb1Δ, mmr1Δ and mfb1Δ mmr1Δ cells. (b) Relative mitochondrial Cit1p-mCherry intensity distribution in WT, mfb1Δ, mmr1Δ and mfb1Δ mmr1Δ cells in regions as defined in Fig. 1b. The data shown for WT and mfb1Δ cells are the same as in Fig. 2d. Data (n>40 for each strain) are representative of three independent experiments. (c) Mid-log-phase cells expressing mito-roGFP1 were visualized by fluorescence microscopy. Panels show representative images (left) and quantification (right) of the whole-cell reduced/oxidized mito-roGFP1 ratio in WT, mfb1Δ, mmr1Δ and mfb1Δ mmr1Δ cells; higher numbers and warmer colours indicate more reducing mitochondria (n>40 for each strain). Data are representative of three independent trials. (d) Mid-log-phase cells expressing endogenously tagged Tom70p-mCherry were labelled with DiOC6 and relative ΔΨ was determined from the DiOC6/Tom70p-mCherry intensity ratio as described inMethods. Panels show representative images (left) and quantification (right) of the whole-cell DiOC6/Tom70p-mCherry ratio; (n>200 from independent 3 trials); higher numbers and warmer colours indicate higher ΔΨ. (e) Kaplan–Meier survival plot showing RLS in WT, mfb1Δ, mmr1Δ and mfb1Δ mmr1Δ cells. Data shown for WT and mfb1Δ cells are the same as in Fig. 3e. (f) Growth curves for WT, mmr1Δ, mfb1Δ and mfb1Δ mmr1Δ cells in SC medium at 30 °C. Maximum growth rates were calculated for intervals of 2 h. (b,f) Error bars are s.e.m. (c,d) Central bands in the boxes represent the median, boxes indicate the middle quartiles and whiskers extend to the 5th and 95th percentiles; red dots indicate points beyond this range. For all images, cell outlines are shown in white; scale bars, 1 μm. Statistical significance was determined using the Wilcoxon rank-sum test (d) and the log-rank test for e (WT versus mfb1Δ, P<10−11; WT versus mfb1Δ mmr1Δ, P=0.259; mfb1Δ versus mfb1Δ mmr1Δ, P<10−9; mmr1Δ versus mfb1Δ mmr1Δ, P<0.05) or the Student's t-test (b,c,f). *P<0.05, **P<0.01 and ***P<0.005.

