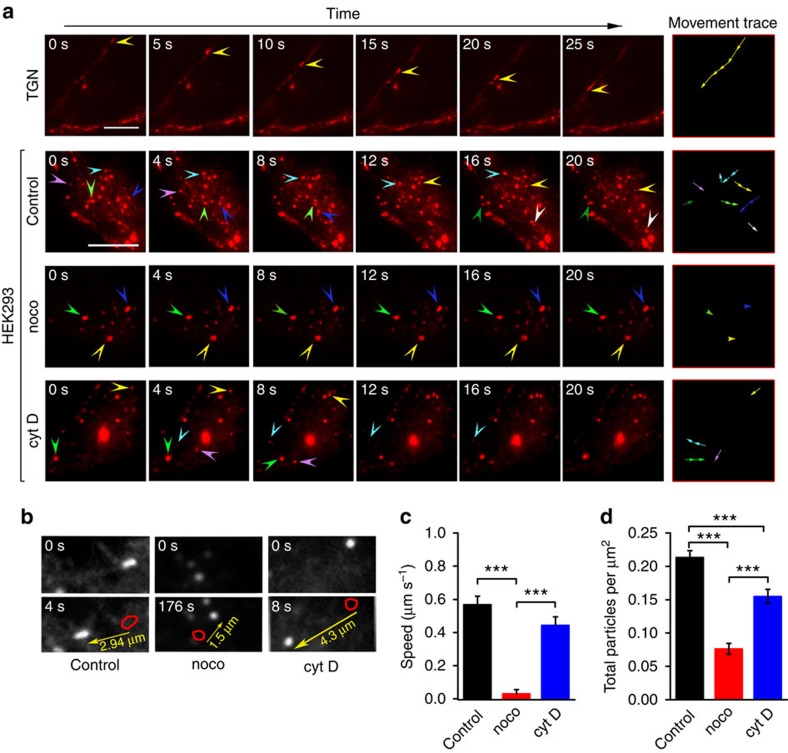
Figure 1. Rapid vesicular transport of TRPM8 via microtubules.
(a) TIRF images at consecutive intervals showing the movement of TRPM8–mCherry in TGN, control HEK293 cells and HEK293 cells treated with nocodazole (30 μM) and cytochalasin D (2 μM). The arrowheads point at moving TRPM8-positive structures. The rightmost column depicts the movement trace of the structures highlighted by the arrowheads. Scale bar, 10 μm. (b) TIRF images for control, nocodazole-treated and cytochalasin D-treated HEK293 cells illustrating the movement of TRPM8-positive structures in the indicated time interval, allowing calculation of the movement speed. The arrow indicates the direction and distance of movement. (c) Average speed of movement of the TRPM8-positive structures in control (n=26) cells and cells treated with nocodazole (n=20) and cytochalasin D (n=20) following the procedure depicted in b. (d) Quantification of the density of TRPM8-positive structures in control cells and cells treated with nocodazole and cytochalasin D. Significance was determined by 1-way ANOVA with Tukey's post hoc test; ***P<0.001.

