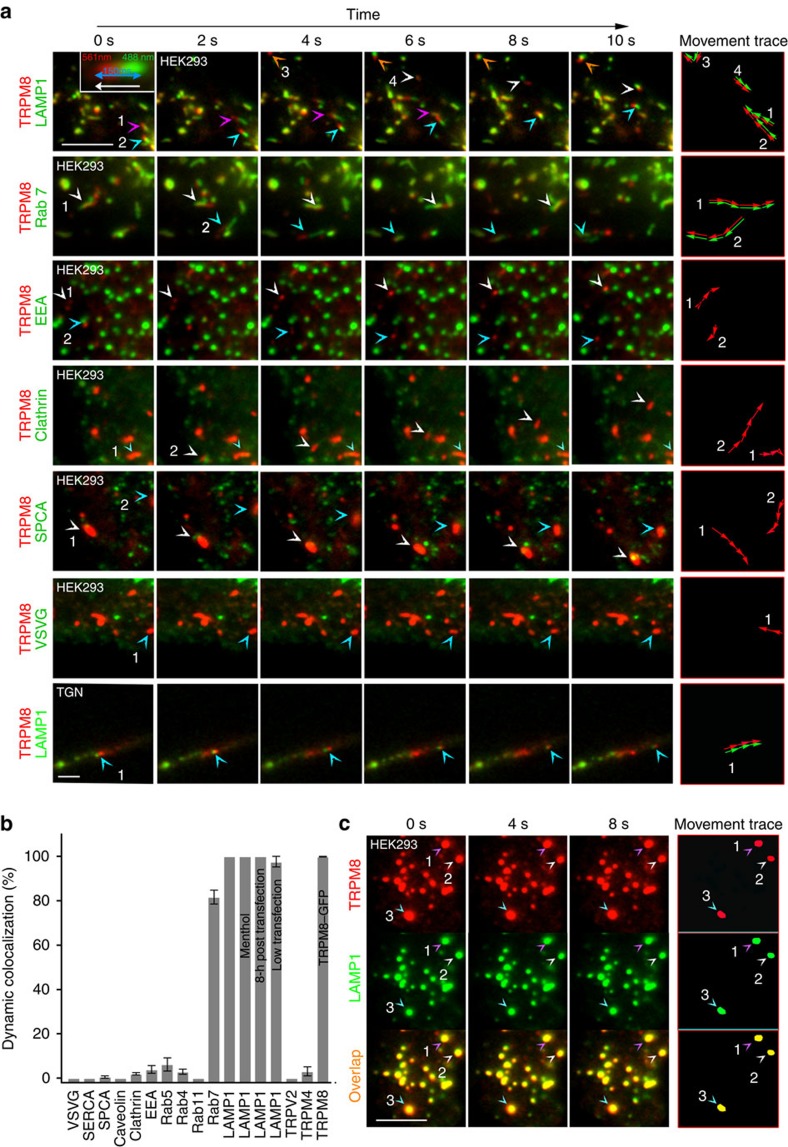
Figure 2. TRPM8 colocalizes with LAMP1 and Rab7 in mobile vesicles.
(a) Dual-colour TIRF images at consecutive intervals showing the movement of TRPM8–mCherry (red) along with the indicated GFP-coupled marker proteins (in green) following co-expression in HEK293 cells or TGN. The arrowheads point at moving structures whose movement is tracked in the rightmost column. Scale bar, 5 μm. (b) Quantification of dynamic co-localization of TRPM8–mCherry with the indicated GFP-coupled proteins in HEK293 cells using the dynamic co-localization score (DCS). Data are shown as mean±s.e.m. (SPCA1, Caveolin, EEA1, Rab4, TRPV2, TRPM4 and TRPM8–GFP: n=6 cells; Clathrin and Rab4: n=8; Rab7, n=9; Rab11 and VSVG: n=12). DCS for LAMP1 was determined under control conditions (n=40), during a 5-min stimulation period with 50 μM menthol (n=6), at 8 instead of 16 h post transfection (n=8) and after reduction of the expression level of TRPM8–mCherry (n=6), as quantified in Supplementary Fig. 1. (c) Dual-colour TIRF images showing a high degree of static co-localization of TRPM8–mCherry and LAMP1–GFP following treatment with 30 μM of nocodazole. Scale bar, 5 μm.

