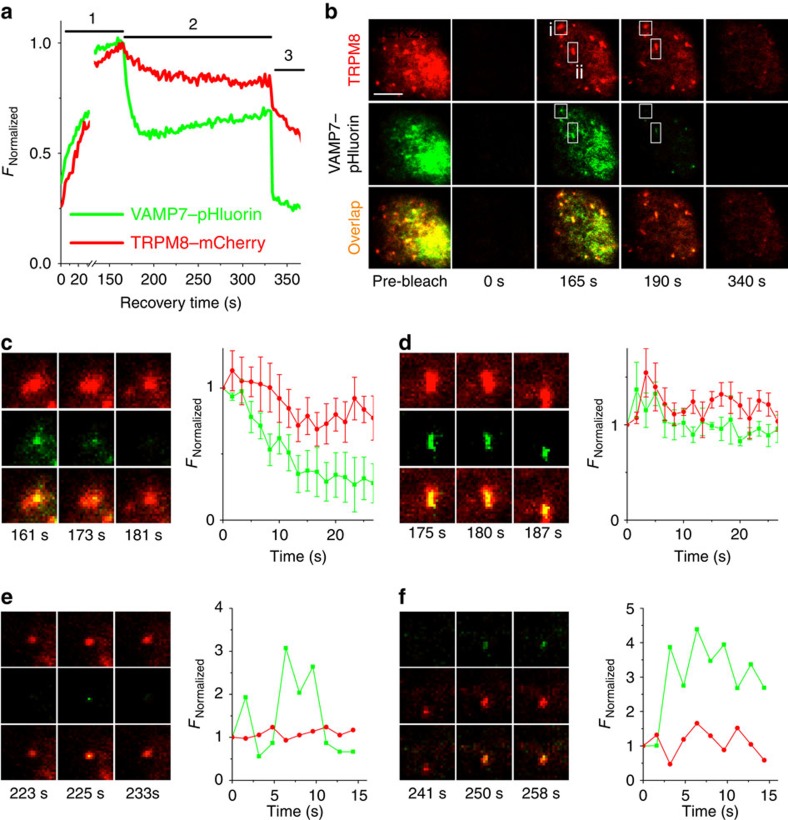
Figure 6. Vesicles containing TRPM8 and VAMP7 fuse with the plasma membrane.
(a) Time course of total pHluorin and mCherry fluorescence following bleaching of the perimembrane area in normal extracellular solution at pH 7.4 (1), in acetate-containing solution at pH 7.4 (2), and in acetate-containing solution at pH 5.5 (3). (b) TIRF images obtained at the indicated time points. Scale bar, 5 μm. Boxed area indicate the regions analysed in c and d. (c) (left) TIRF images for boxed area (i) taken at the indicated time points. Frame dimension in c-f is 3 × 3 μm. (right) Mean fluorescence time course of structures that show similar acetate-induced quenching of green fluorescence, indicating localization of pHluorin in the lumen of an intracellular vesicle. (d) (left) TIRF images for boxed area (ii) taken at the indicated time points. (right) Mean fluorescence time course of structures that show similar insensitivity to acetate-induced quenching, indicating localization at the plasma membrane. (e,f) Individual vesicle fusion events observed in acetate-containing solution at pH 7.4, characterized by a sudden and transient (e) or more sustained (f) appearance of pHluorin fluorescence.

