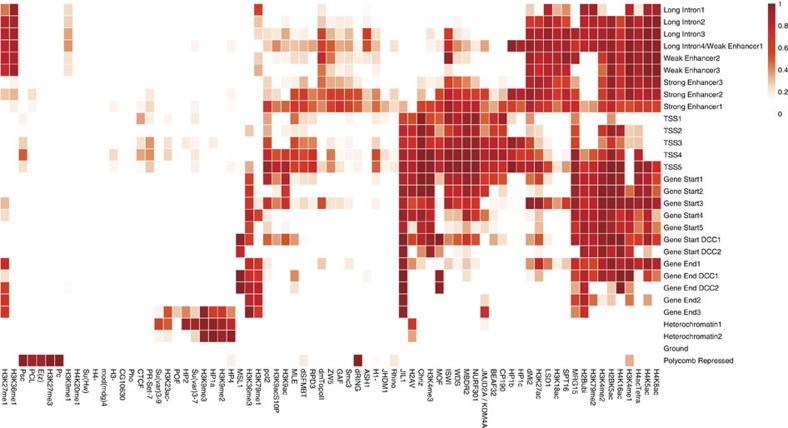
Figure 2. Distinct functional properties of chromatin states reflected in state-specific chromatin factor compositions.
Chromatin factor compositions of each chromatin state, showing the average frequency of observing each of the 73 chromatin factors within each state. Each chromatin state displays distinctive marks. The x axis shows the 73 chromatin factors, whereas the y axis shows the 30 chromatin states. It is noteworthy that for chromatin factors H3K23ac-, H1-, H3- and H4-, the average frequency of these protein/marks being absent rather than present is shown, in consistency with the model. Only chromatin factors enriched with P-value<0.01 by permutation test are shown. The null distribution of the permutation test is computed by permuting chromatin state annotations by 50-kbp-length blocks.

