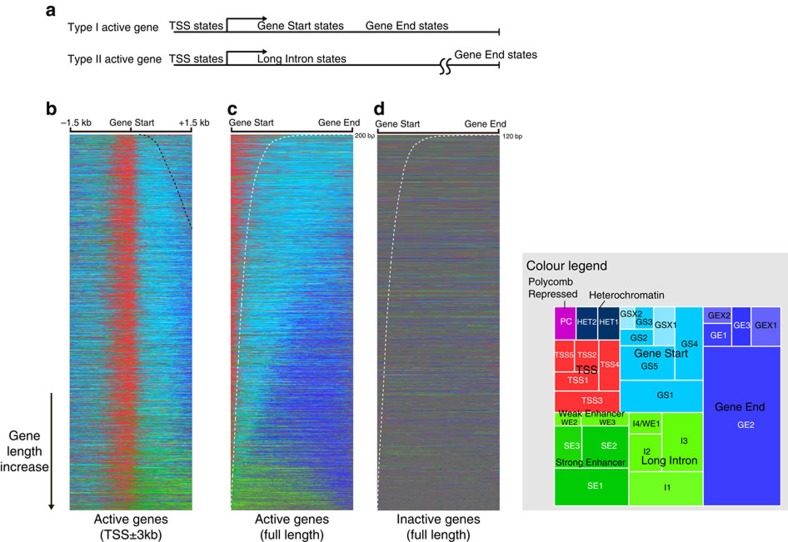
Figure 5. Spatial organization analysis reveals active gene chromatin state sequences.
(a) Actively transcribed genes show a canonical chromatin state sequence anchored by distance to TSS and an alternative sequence is observed in a group of larger genes with high proportion of Long Intron states. (b,c) Canonical and alternative gene state sequences. Genes are sorted by length with shorter genes shown at the top. The −1.5 to +1.5 kb region relative to TSS for each gene is shown in b and each gene is scaled by its length to show the whole gene in c. Black dashed line in b shows gene length when it is within the 0–+1.5 kb range. White dashed line in c shows the same genomic length scale represented in different genes. Chromatin state groups are colour coded as in colour legend provided on the right. Size of a block in the colour legend is proportional to the total coverage of the state. For chromatin states: GS, Gene Start; GSX, Gene Start DCC; GE, Gene End; GEX, Gene End DCC; HET, Heterochromatin; I, Long Intron;PC, Polycomb Repressed; SE, Strong Enhancer; TSS, transcription start site; WE, Weak Enhancer. (d) Inactive genes are generally covered by the Ground state (grey) and show no dominant spatial organization pattern. As in c, each gene is scaled by its length, and the white dashed line indicates the fixed length scale represented in different gene.

