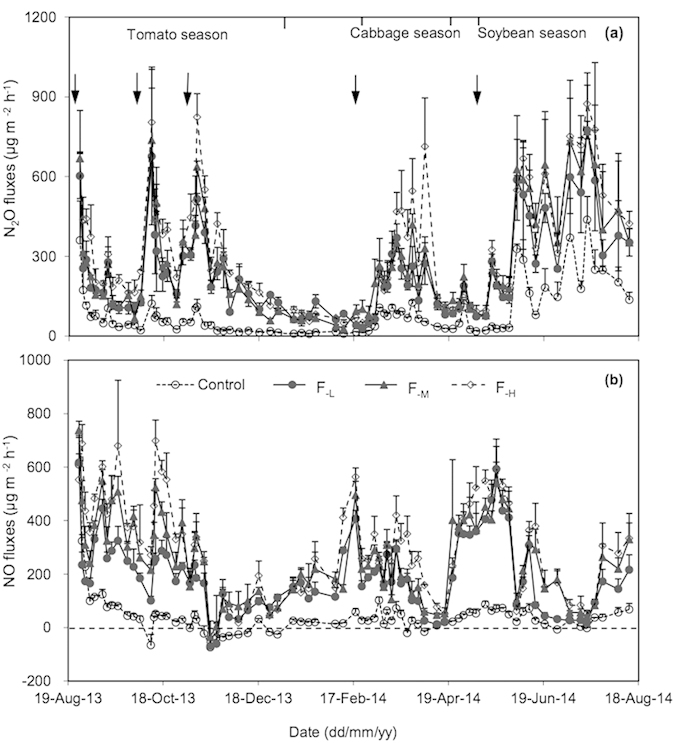
Figure 1.

Seasonal dynamics of N2O (a) and NO (b) fluxes from greenhouse vegetable cropping systems over the 2013–2014 annual cycle. Arrows represent basal fertilization and topdressing events. The bars indicate the standard errors of mean (n = 3). F−L, F−M and F−H refer to N fertilizer treatments at the low, medium and high application rates, respectively.
