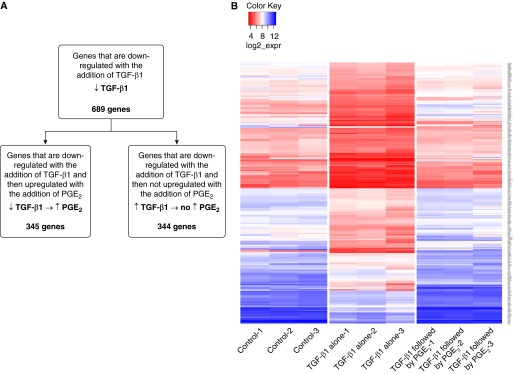
Figure 5.
Graphic depiction of the genes down-regulated by TGF-β1 and the effect of subsequent PGE2 treatment. (A) TGF-β1 down-regulated the expression of 689 genes compared with control cells. Of those, 345 were reversed when treated with PGE2. (B) Heat map of the 345 genes down-regulated by TGF-β1 and reversed by PGE2. Values are expressed as the log 2 of raw expression values.

