Figure 4.
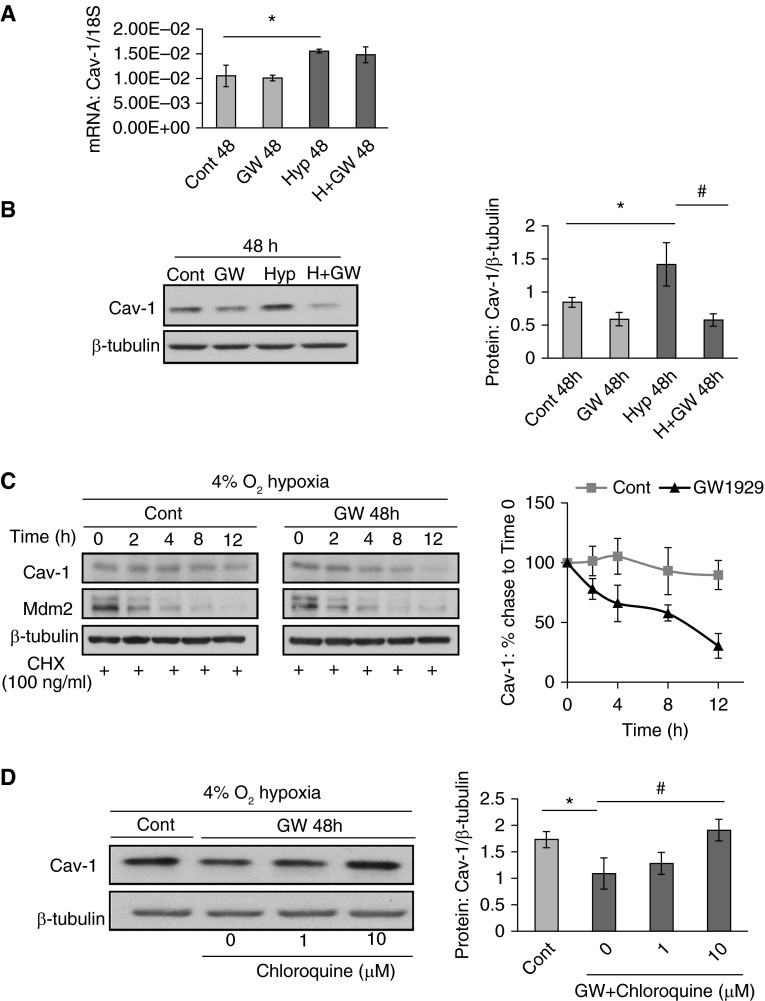
PPARγ agonist, GW1929, inhibits hypoxia-elevated Cav-1 protein level by promoting its lysosomal degradation. (A) Real-time qPCR data showing the effects of GW1929 (10 μM, 48 hours) on Cav-1 mRNA expression under Nor and Hyp conditions. Data are presented as means (± SEM); n = 3 in each group. (B) Western blots showing the expression pattern (left) of Cav-1 and β-tubulin in response to GW1929 (10 μM) treatments under Nor and Hyp and quantified data measuring the gray density of Cav-1 as normalized to β-tubulin. Data are presented as means (± SEM); n = 5 in each group. *P < 0.05 versus control at 48 hours; #P < 0.05 versus Hyp 48 hours. (C) Western blots showing the expression pattern (left) of Cav-1, mouse double minute 2 homolog (Mdm2), and β-tubulin after the treatments with/without GW1929 (10 μM, 48 hours) and underwent cycloheximide (CHX; 100 ng/ml) chase for a time series. (Right) Line graph shows the quantified data measuring the gray density of Cav-1 as normalized to β-tubulin. Data are presented as means (± SEM); n = 4 in each group. (D) Western blots showing the expression pattern (left) of Cav-1 and β-tubulin after the treatments of GW1929 (10 μM, 48 hours) in the presence of different doses of chloroquine. (Right) Line graph shows the quantified data as measuring the gray density of Cav-1 as normalized to β-tubulin. Data are presented as means (± SEM); n = 4 in each group. *P < 0.05 versus control; #P < 0.05 versus GW + chloroquine (0 μM).

