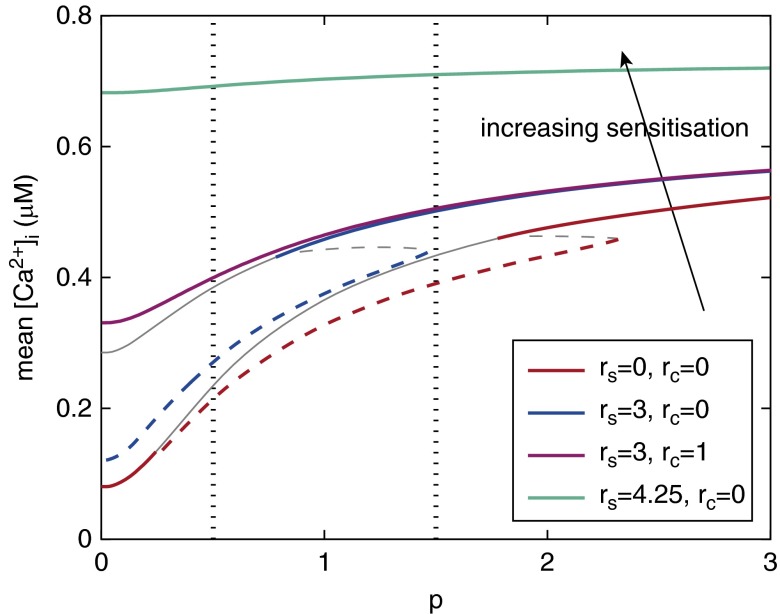
Figure 5.
Effect of different levels of RyR sensitization (increasing as indicated by the arrow) on the entire dose–response curve relating mean [Ca2+]i to [IP3] during agonist stimulation. Dashed curves correspond to Ca2+ oscillations and solid curves to steady Ca2+. Dotted vertical lines indicate the [IP3] values used in Figures 3A and 3B. The bottom (red) curve is the dose–response curve in the absence of sensitization; hence, it corresponds to the response curve in Figure E2A. Gray curves represent unstable solutions.

