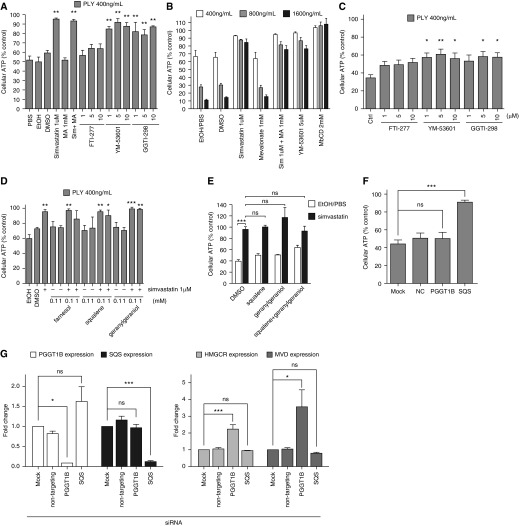
Figure 6.
YM-53601 and GGTI-298 treatment mimicked simvastatin-mediated protection against pneumolysin. (A and C) HBE1 cells (A) and NHBE cells (C) were treated with 1 μM simvastatin with or without 1 mM mevalonate or various doses of mevalonate downstream pharmacological inhibitors for 24 hours and then challenged with 400 ng/ml PLY for 4 hours. Asterisks in (A) indicate significant statistical difference versus matching control based on one-way ANOVA with Dunnet’s post test. (B) HBE1 cells were pretreated with 1 μM simvastatin with or without 1 mM mevalonate or with the indicated doses of YM-53601 or MβCD as a cholesterol-depleting positive control for 24 hours and then challenged with PLY at the indicated doses for 4 hours. Cellular ATP release assays were used to assess cell viability. All the treatments except MA alone have significant increases in cell viability compared with individual control treatment by two-way ANOVA and Bonferroni’s post test. (D) HBE1 cells were pretreated with simvastatin with or without farnesol, squalene, or geranylgeraniol for 24 hours and then challenged with PLY for 4 hours. (E) HBE1 cells were pretreated with simvastatin with or without 0.1 mM squalene and with or without 0.1 mM geranylgeraniol for 24 hours and then challenged with PLY for 4 hours. Cellular ATP release assays were used to assess cell viability. Asterisks indicate significant statistical difference versus matching groups based on one-way ANOVA with Tukey’s post test from four experiments. (F) The gene knockdown of squalene synthase in HBE1 cells mimicked the simvastatin-mediated protection against PLY. For D and F, asterisks indicate significant statistical difference versus matching control based on one-way ANOVA with Dunnet’s post test. (G) The efficacy and effect on HMGCR and MVD gene expression of PGGT1B and squalene synthase gene silencing in HBE1 cells were examined by quantitative RT-PCR. Asterisks indicate significant statistical difference versus matching groups based on one-way ANOVA with Tukey’s post test. Error bars represent SEM of three experiments in A, B, D, F, and G and two experiments in C. MVD, mevalonate decarboxylase; PGGT1B, protein geranylgeranyltransferase type I, beta subunit; SQS, squalene synthase. *P < 0.05; **P < 0.01; ***P < 0.001. NC, negative control; Sim, simvastatin.

