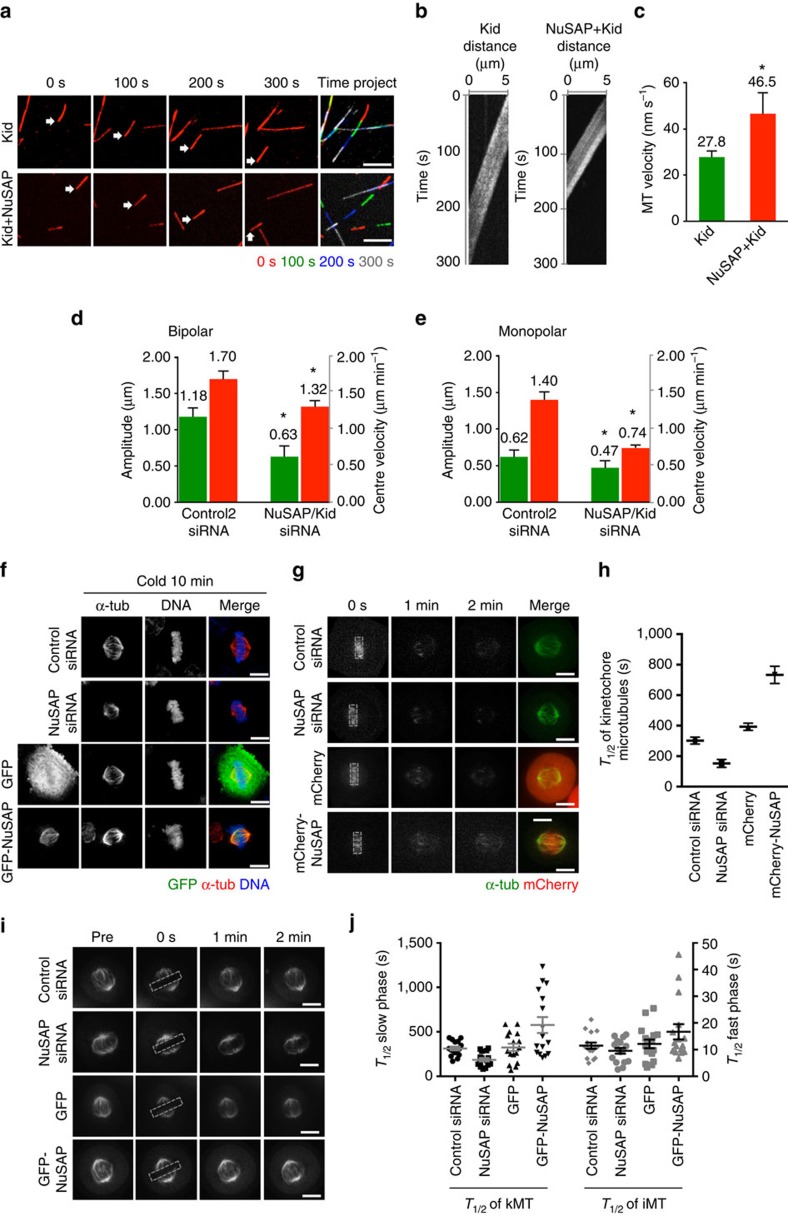
Figure 7. NuSAP governs Kid-generated PEF during chromosome oscillation.
(a) Representative images and colour project of MT gliding assay with Kid or NuSAP and Kid proteins. Arrows represent one MT gliding at different time points. Images were acquired in a 2 s interval for 5 min. Scale bar, 3 μm. (b) Kymographs showing a sample microtubule gliding on Kid-coated surfaces in the presence or absence of NuSAP protein. (c) Bar chart representing the average velocity of MT gliding on Kid-coated surfaces in the presence or absence of NuSAP protein. Error bars represent±s.d. *P<0.01, by t-test. (d) Bar chart representing the average of the amplitude (black) and centre velocity (grey) of centromere oscillation in control- or NuSAP/Kid-double-depleted metaphase cells. Error bars represent +s.e.m. *P<0.001, by t-test. (e) Bar chart representing the average of the amplitude (black) and centre velocity (grey) of centromere oscillation in control- or NuSAP/Kid-double-depleted monopolar cells. Error bars represent +s.e.m. *P<0.001, by t-test. (f) The kinetochore MTs in metaphase HeLa cells transfected with control siRNA, NuSAP siRNA, GFP-vector or GFP-NuSAP after cold treatment. Cells were stained with an anti-α-tubulin antibody and DNA with Hoechst 33342. Scale bar, 5 μm. (g) Representative images of PAGFP α-tubulin stability in metaphase HeLa cells transfected with control siRNA, NuSAP siRNA, mCherry vector or mCherry-NuSAP after photoactivation. Dotted squares represent photoactivated region. Scale bar, 5 μm. (h) Bar chart of the half-lives of spindle MTs calculated with a double exponential regression fitting of photoactivation assays. n (control siRNA)=14 cells, n (NuSAP siRNA)=13, n (mCherry)=13, n (mCherry-NuSAP)=12. Error bars represent ±s.d. (i) FRAP assays; representative images of MT dynamics in metaphase stable mCherry-α-tubulin HeLa cells transfected with control siRNA, NuSAP siRNA, GFP-vector or GFP-NuSAP after photobleaching. Dotted squares represent the photobleaching region. Scale bar, 5 μm. (j) Dot plot representing the half-life of kinetochore microtubules (slow phase) and interpolar microtubules (fast phase) calculated according to a double exponential regression curve with FRAP assays in control siRNA-, NuSAP siRNA-, GFP-vector- or GFP-NuSAP-transfected metaphase cells. Mean±s.e.m. are indicated.

