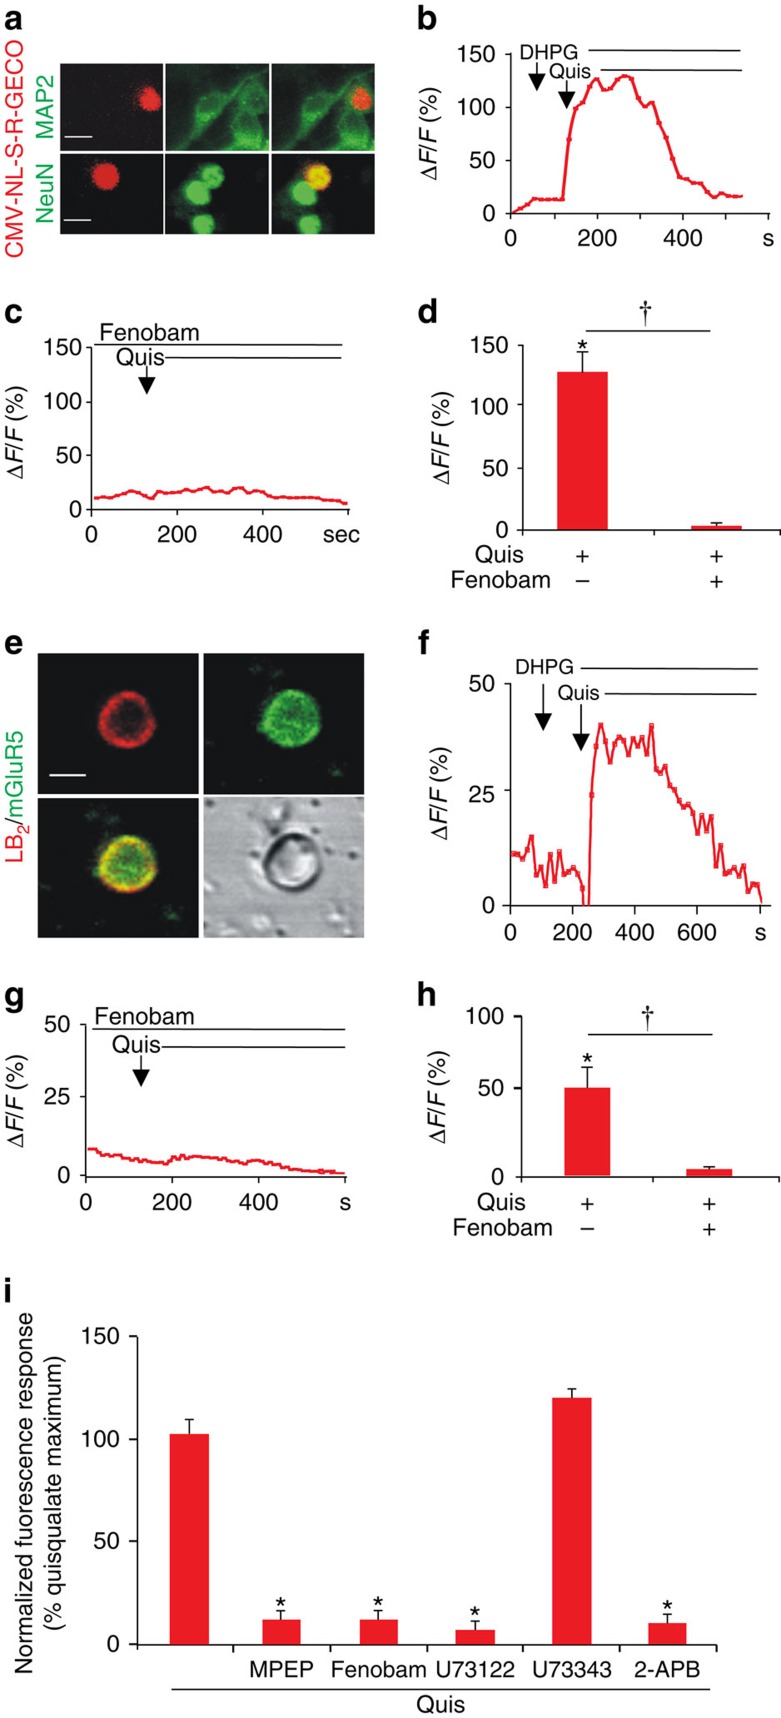
Figure 2. mGluR5-mediated nuclear Ca2+ changes in SCDH neurons or isolated nuclei.
Cultured rat SCDH neurons were transfected with the nuclear-targeted red fluorescent, genetically encoded Ca2+ indicator, CMV-NL-S-R-GECO, on DIV6 and then immunostained or imaged in real time on DIV9. (a) Images of SCDH neurons transfected with CMV-NL-S-R-GECO (red) expressed in neuronal cells (as indicated by MAP2 staining; green in the upper panel) and colocalized with the neuronal nuclear marker, NeuN (green in the lower panel) Scale bar, 10 μm. (b) Representative trace of nuclear Ca2+ responses to agonist stimulation. DHPG application (100 μM) did not induce Ca2+ changes whereas quisqualate (Quis, 10 μM) application resulted in sustained nuclear Ca2+ rises. (c) Fenobam (10 μM) blocked Quis-induced nuclear Ca2+ responses. (d) Compiled data from peak ΔF/Fo (%) with N=22 identified nuclei (b) and N=50 nuclei (c) Student's t-test, *P<0.05, compared with baseline; †P<0.05, Quis alone compared to Quis+fenobam. (e) Image of purified nucleus from L4–L6 SCDH stained with lamin B2 (red) and mGluR5 (green). Scale bar, 5 μm. (f) Isolated SCDH nuclei were loaded with Oregon Green BAPTA and imaged to acquire baseline Ca2+ changes before agonist application in the presence of AMPA and mGluR1 receptor antagonists. Representative trace of nuclear Ca2+ responses to agonist stimulation. DHPG application (100 μM) did not induce Ca2+ changes, while quisqualate (Quis, 10 μM) application resulted in sustained nuclear Ca2+ rises. (g) Fenobam (10 μM) blocked the nuclear Ca2+ response induced by Quis. (h) Compiled data from peak ΔF/Fo (%) with N=5 identified nuclei (f) and N=15 identified nuclei (g) Student's t-test, *P<0.05, compared with baseline †P<0.05, Quis alone compared to Quis+fenobam. (i) SCDH cultures (35,000 cells per well) were preincubated with indicated inhibitors (10 μM MPEP, 10 μM Fenobam, 5 μM U73122, 5 μM U73343, 100 μM 2-APB), loaded with Fura-2 AM before EC80 quisqualate (5.2 μM) addition and Ca2+ flux measurement. Three separate experiments were done in triplicate, Student's t-test, *P<0.05, compared to quisqualate alone. All values in figure are expressed as mean±s.e.m.

