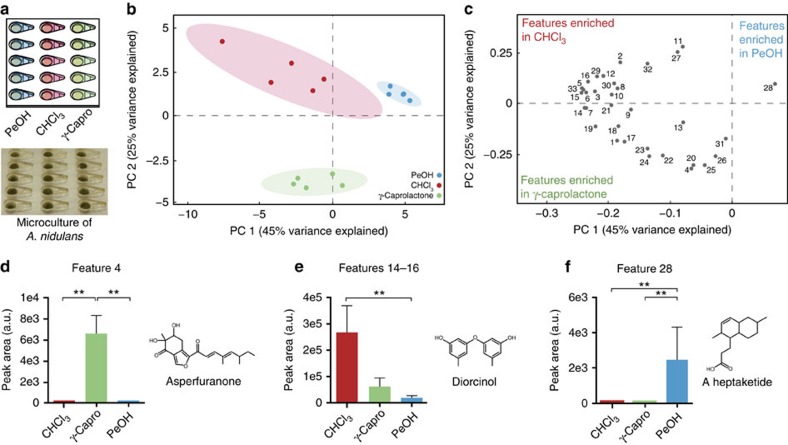
Figure 3. Solvent selection impacts extraction of secondary metabolites.
(a) Experimental design and culture photo. PeOH is 1-pentanol, CHCl3 is chloroform and γ-Capro is γ-caprolactone. (b) Principal component analysis of A. nidulans cultured in the micrometabolomics platform. Only features that could be annotated as known secondary metabolites were used for clustering (Table 1). Each dot represents one of five independent cultures per condition from one experiment and the shaded ellipses represent 95% confidence intervals. Variance explained refers to the amount of total variation observed between samples that can be attributed to segregation along that principal component. (c) Loadings plot of individual features for the PCA in b. (d–f) Peak areas (integrated peak intensities, arbitrary units (a.u.)) of three of the features numbered in c. Error bars represent s.d. of the five replicates and statistics were performed using the Kruskal–Wallis test as described in the methods; **P value <0.01. Peak areas for features 14–16 were summed as they are adducts of the same compound. Structures are of the putative annotation for each peak.

