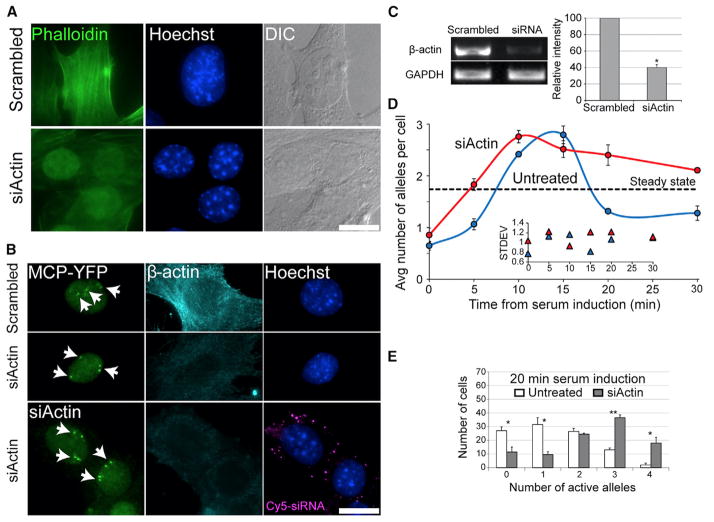
Figure 5. β-Actin Knockdown Results in Increased β-actin Transcription following Serum Induction.
(A) Cells treated with scr-siRNA or siRNA to β-actin stained with phalloidin/fluorescein isothiocyanate (green), Hoechst (blue), or DIC (gray). The reduction in actin stress fibers is seen, while MCP-YFP remains.
(B) β-actin expression levels at the 10-min time point comparing cells treated with Cy5-labeled actin siRNA (cytoplasmic magenta dots) or scr-siRNA. Active alleles detected by the MCP-YFP protein (green). β-actin protein levels were examined by a β-actin antibody (cyan) and Hoechst (blue). Scale bar, 10 μm.
(C) β-actin mRNA levels were reduced by siRNA (error bar, SD; *p < 0.0005). A scrambled siRNA was used as a control and expression levels were normalized to GAPDH mRNA levels.
(D) The average number of active alleles per cell in actin siRNA-treated cells (red line) versus untreated cells (blue line). Dotted black line represents the average number of active alleles per cell under steady-state conditions in untreated cells. Inner plot represents the SD of the distribution of active allele numbers for untreated and actin siRNA-treated cells (100 cells for each time point; error bar, SD).
(E) Comparing the number of active β-actin alleles for the 20-min time point between untreated (white) and actin siRNA-treated cells (gray) (100 alleles; error bar, SD; *p < 0.05, **p < 0.01).

