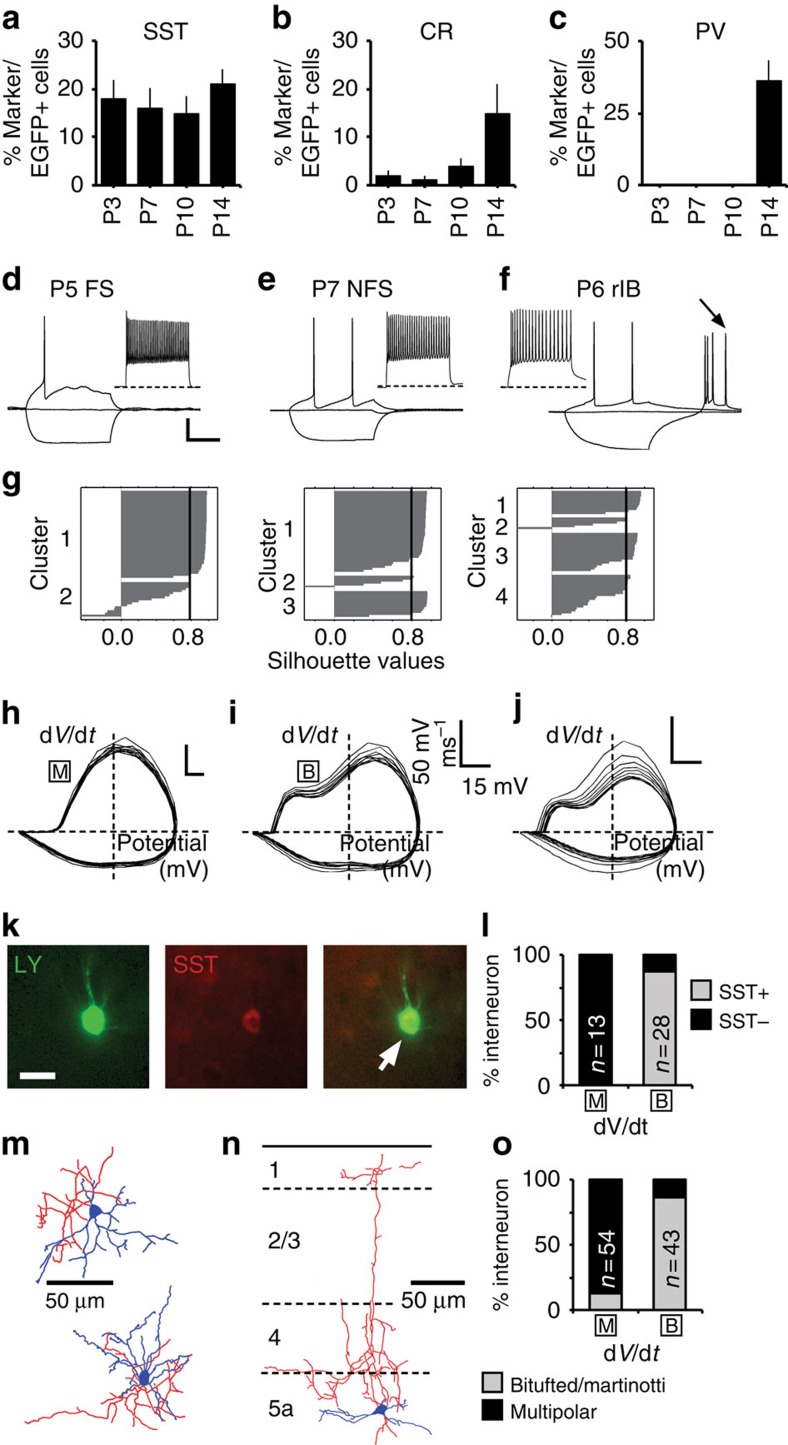
Figure 3. Identification of Nkx2-1 interneuron subtypes through early postnatal development.
(a) Percentage of Nkx2-1Cre;Z/EG EGFP+ cells expressing somatostatin (SST) across the depth of a 250-μm width column of S1BF neocortex at four time points through early development; corresponding data for (b) calretinin (CR) and (c) parvalbumin (PV; data obtained from n≥4 brains). Responses to threshold and hyperpolarizing current injection of d P5 fast spiking (FS) interneuron; (e) P7 non-fast spiking (NFS) interneuron; (f) P6 rebound intrinsic spiking interneuron (rIB), arrow, burst of action potentials observed following release from hyperpolarizing current injection; scale bar, 20 mV, 200 ms. Inset: near maximal firing frequency recordings for the corresponding cells. (g) Silhouette plot derived from k-means cluster analysis with k (the number of clusters) set at 2 (left), 3 (middle) and 4 (right plot). (h–j) Phase plot (dV/dt versus voltage) for the same cells as d–f observed in response to suprathreshold current injection sufficient to elicit 10 spikes (20 Hz). [B], biphasic rising phase; [M], monophasic rising phase. (k) SST expression (arrow) in the recovered Lucifer yellow (LY)-filled soma of the neuron shown in e (scale bar, 12 μm). (l) Relationship between phase plot profile (x axis; M, monophasic, B, biphasic) and expression of SST in recorded immature interneurons. (m,n) Reconstructed morphologies of early Nkx2-1 interneurons with characteristic multipolar, local arbor, SST-negative, immature FS interneurons. (n) Distinctive ascending axon of a SST-expressing immature NFS interneuron. Approximate layer boundaries indicated by the dashed lines. (o) Histogram showing the percentage of cells assigned to a given phase plot profile (x axis) that were classified as either bitufted dendritic morphology (grey bar), often with an ascending axons (Martinotti), or multipolar dendrites (black; typically ≥4 primary dendrites).

