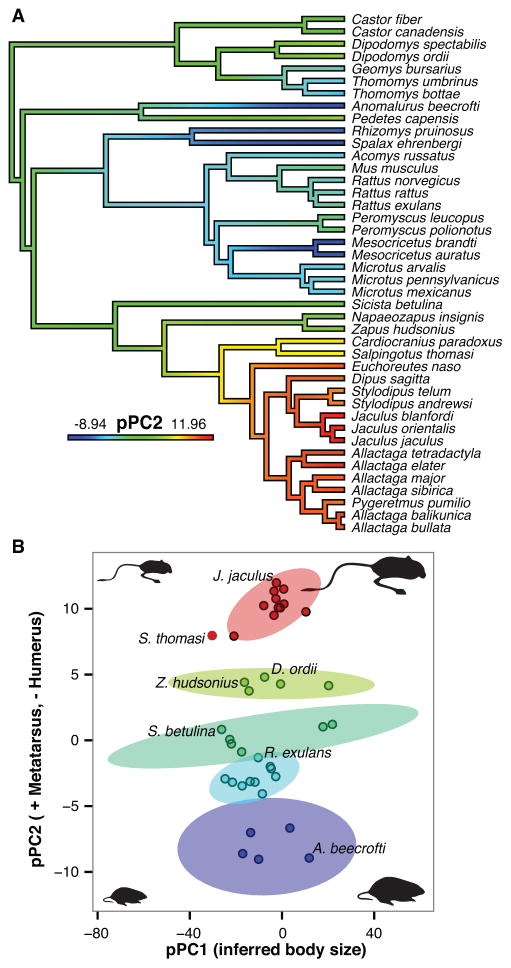
Figure 4. Phylogenetically corrected principal components analysis illustrates major proportional differences across rodent limbs.
(A) pPC2 is mapped as a continuous trait on the phylogeny of rodents with ancestral states reconstructed (graded color). (B) Clusters of similar ecomorphs plotted with respect to pPC1 (representing variation due to body size; 90.9% of the total variance) and pPC2 (representing degree and direction of limb specialization; 86.1% of remaining variance with pPC1 removed). Shaded ellipses demark the 95% confidence interval of each cluster.

