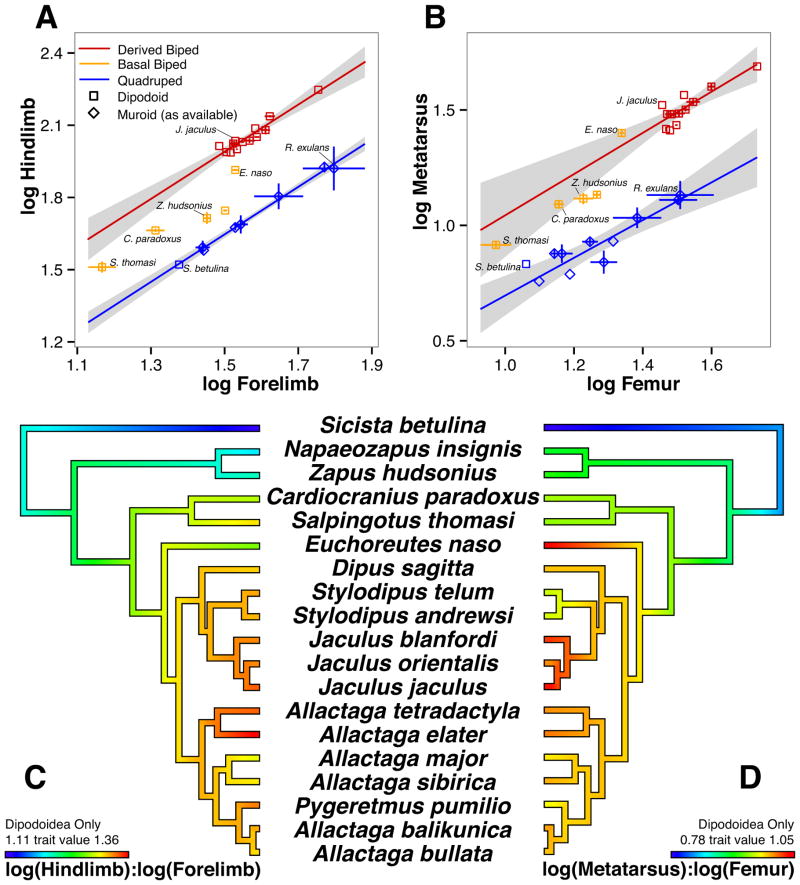
Figure 5. Allometric scaling between limbs and within the hindlimb illustrates the complex evolution of proportion.
Log-log plots illustrating scaling of (A) hindlimb versus forelimb and (B) metatarsus versus femur. Derived bipeds, Allagtaginae and Dipodinae, are designated red. Basal and intermediate bipeds, Zapodinae, Cardiocraniinae, and Euchoreutinae, are designated orange. Quadrupeds that cluster together in the second and third ecomorph groups are designated blue. Grey shading indicates 95% confidence intervals, and vertical and horizontal lines represent variation one standard deviation away from the mean. Phylogenies of Dipodidae, with (C) log10(hindlimb):log10(forelimb) or (D) log10(metatarsal):log10(femur) mapped as continuous traits with ancestral states reconstructed by maximum likelihood (graded color).

