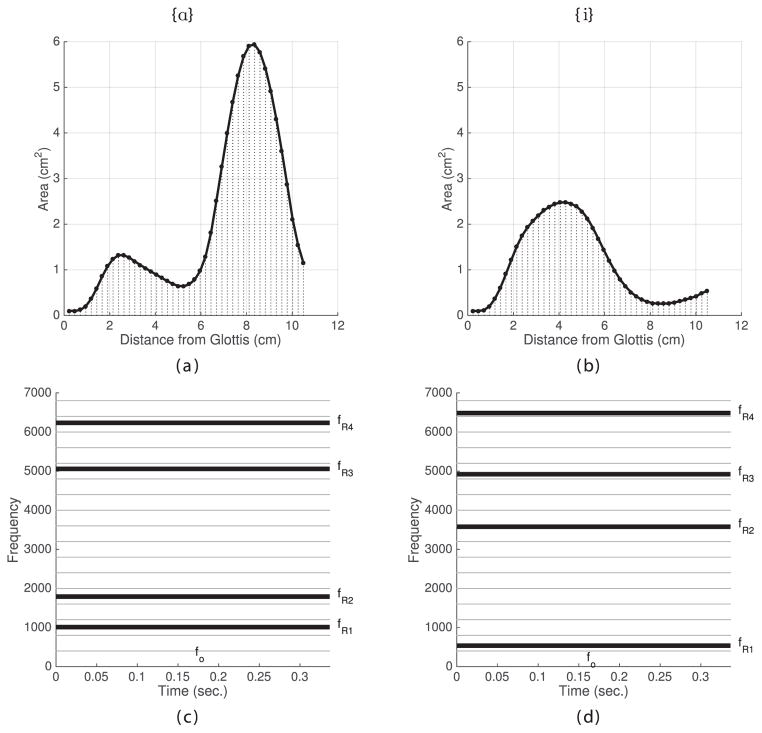
Figure 2.
Area functions and corresponding idealized spectrographic plots for child-like {ɑ} and {i} vowels in “Set 1.” The dots along each area function (a & b) represent the ith consecutive section ordered from glottis to lips. The spectrographic plots include the calculated resonance frequencies, fRn, as thick black lines and the fo and harmonic components as thin gray lines.

