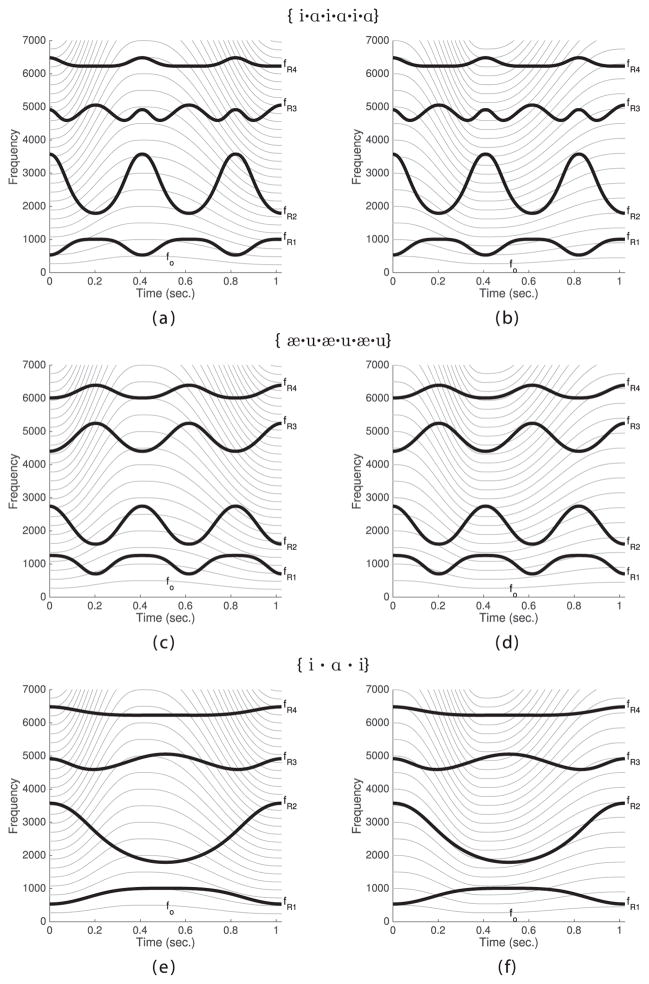
Figure 3.
Idealized spectrographic plots for the six time-varying simulations in “Set 2.” In each panel, the calculated resonance frequencies, fRn, are shown as thick black lines, and the fo and harmonic components are plotted as thin gray lines. Note the figure is arranged such that each column corresponds to one of the two fo contours, and each row corresponds to one of three time-varying vocal tracts.

