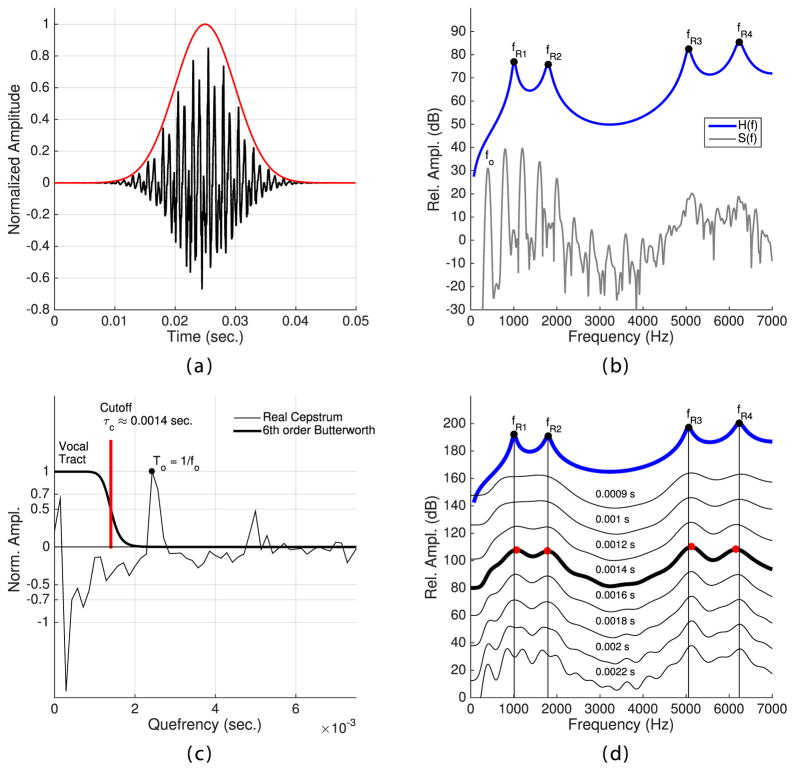
Figure 4.
Design of the spectral filter. (a) 0.05 second segment of the simulated signal, preempha-sized and modified with a Gaussian window. (b) Calculated frequency response of the vocal tract shape in Fig. 4a (blue) and the DFT spectrum of the segment in (a). (c) Real cepstrum (thin line) and quefrency response of a 6th order Butterworth filter (thick line). (d) Calculated frequency response along with spectral envelopes obtained with a range of cutoff quefrency settings.

