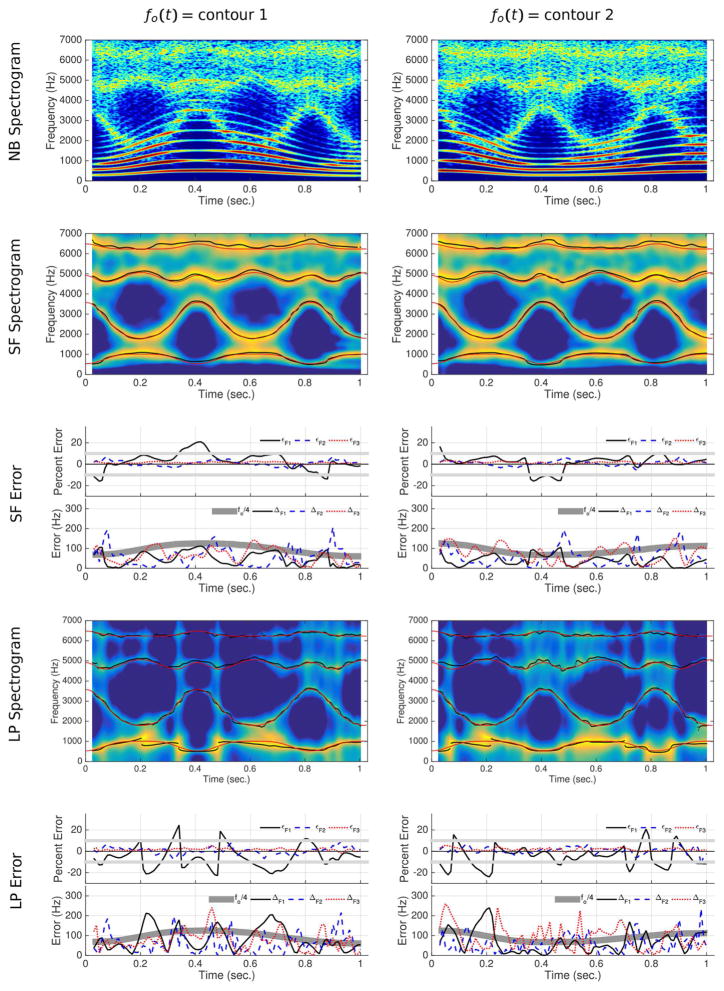
Figure 6.
Results of spectral filtering and linear prediction analysis for two simulations of {i·ɑ·i·ɑ·i·ɑ}. (Top row) Narrowband (NB) spectrograms. (Second row) Spectrographic display of the time-varying envelopes obtained with the spectral filtering (SF) method. Black dotted lines show formant tracking, and red lines are calculated resonances. (Third row) Two types of error calculations for the first three formants tracked with the spectral filtering (SF) relative to the calculated resonance frequencies. (Fourth row) Spectrographic display obtained with linear prediction (LP). Black dotted lines show formant tracking and manual correction, and red lines are the calculated resonances. (Bottom row) Error calculations for the first three LP formants (corrected) relative to the calculated resonance frequencies.

