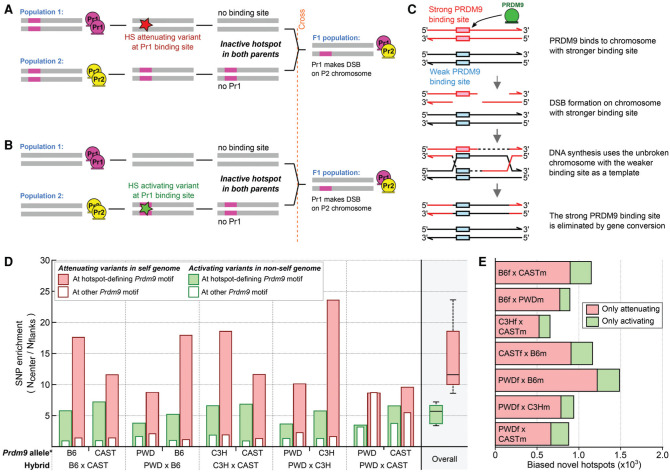
Figure 3.
Sequence variation modulates the DSB hot spot landscape. (A) Appearance of a novel hot spot in the hybrid due to a hot spot-attenuating variant at a PRDM9-binding site in the “self” genome. (B) Appearance of a novel hot spot in the hybrid due to a hot spot-activating variant at a PRDM9-binding site in the “nonself” genome. (C) The mechanism of gene conversion-mediated erosion of PRDM9-binding sites. (D) At novel hot spots, both PRDM9-binding site-activating and -attenuating variants are enriched. ∗We inferred the Prdm9 allele that defined each novel hot spot using the DSB initiation bias. We then inferred the origin of SNPs by comparison across mouse strains (see the Materials and Methods). The SNP density at each hot spot (±250 nt) was compared with that in the flanking region (± 500-nt→2000-nt region), and the enrichment is shown. Solid red bars indicate hot spot-attenuating variants in the “self” lineage. Solid green bars indicate hot spot-activating variants in the “nonself” lineage. Empty bars represent variants assayed at the motif for the other allele of Prdm9 in each hybrid and reflect the variant density at sites not under selection. Both hot spot-activating and -attenuating variants are enriched at novel hot spot centers for all hybrids. (E) We used a motif score threshold of five or greater to assess how many novel hot spots contained only a loss SNP or only a gain SNP in the central 500 bp. SNPs that do not affect motif scores were not considered. On average, loss SNPs are four times more common than gain SNPs.

