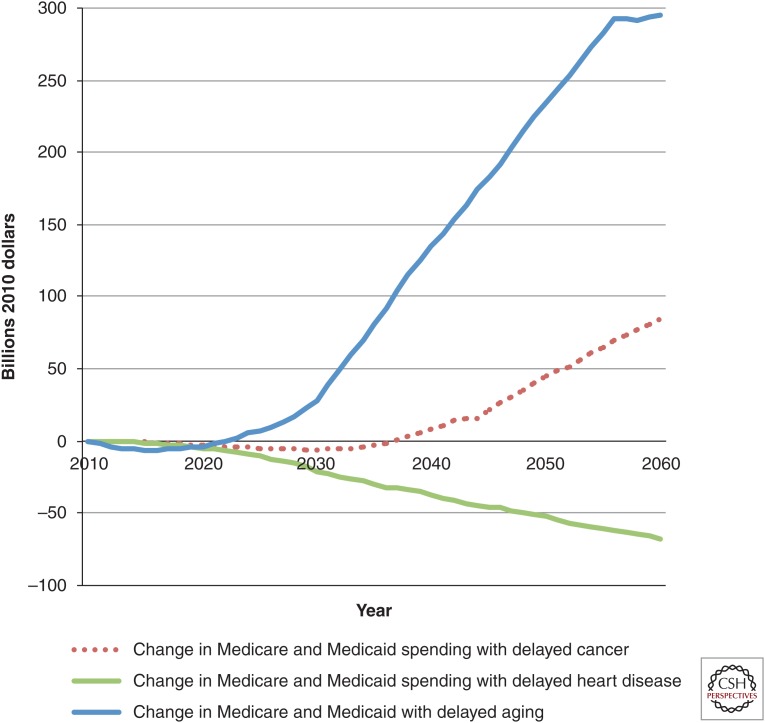
Figure 4.
Change in Medicare and Medicaid spending on health care in various scenarios compared with status quo, billions of dollars, 2010–2060. All spending is in 2010 dollars. The figure shows per period (nondiscounted) projected spending on Medicare and Medicaid under various medical progress scenarios, relative to the status quo scenario for Americans aged 51 or older. Spending is much higher in the delayed aging scenario because of the larger increase in the total population, even though per period costs for Medicare are lower. Calculations are derived from the Future Elderly Model (see www.rand.org/pubs/research_briefs/RB9324/index1.html).

