Fig. 1.

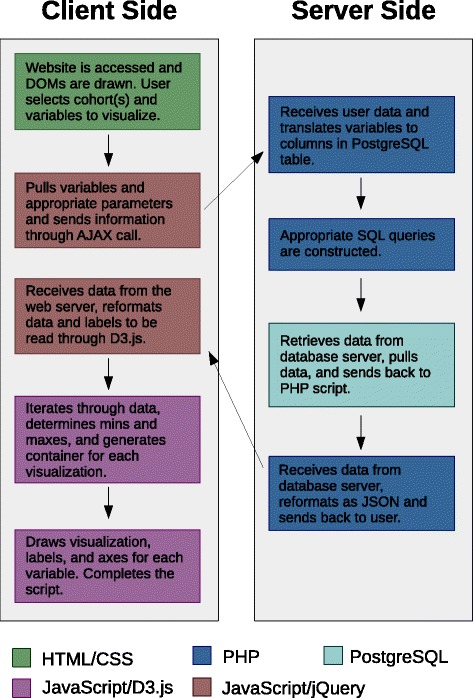
A diagram describing how the visualization tool works. The sequence of steps is indicated by arrows, while the colour of each box refers to the programming language used

A diagram describing how the visualization tool works. The sequence of steps is indicated by arrows, while the colour of each box refers to the programming language used