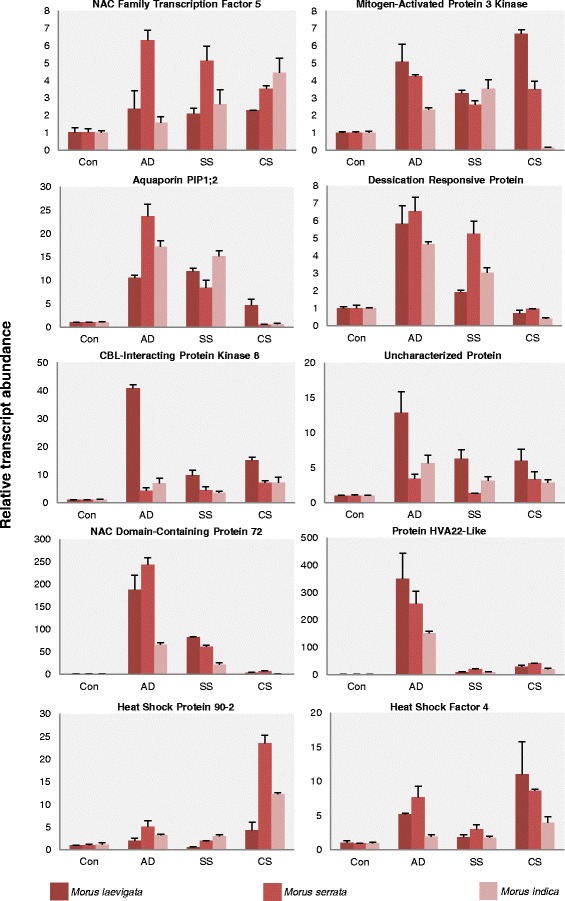
Fig. 9.

Expression analysis of genes under different environmental cues in Morus sp. Con: Mock treated with RO water for five hours, AD: Aerial Drying for five hours, SS: Salt Stress by treatment with 250 mM NaCl for five hours, CS: Cold Stress for five hours. Data represents average of two biological replicates (with three technical replicates each) ± standard error
