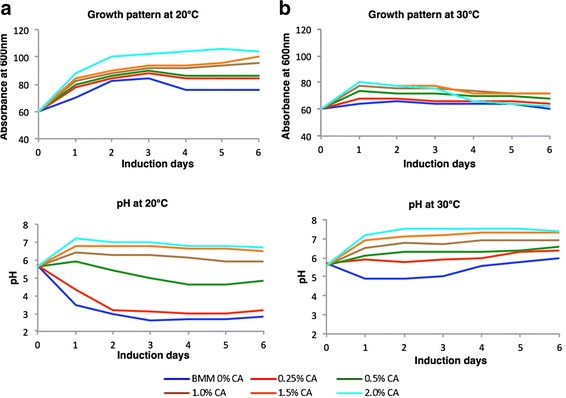
Fig. 3.

Effect of temperature and CA supplementation on cell growth and culture pH. Cultures induced at 20 °C (a) and 30 °C (b) were observed for variation in growth profile (top) and pH (bottom) over time (days). Growth profile was determined by measuring the cell density for each time point at 600 nm. Cells were harvested and pH was measured for the retrieved cell-free media. Tables containing absolute OD600 and pH values are also provided as additional information (Additional file 8: Table S8). Similar trends were observed in two independent induction experiments (Additional file 9)
