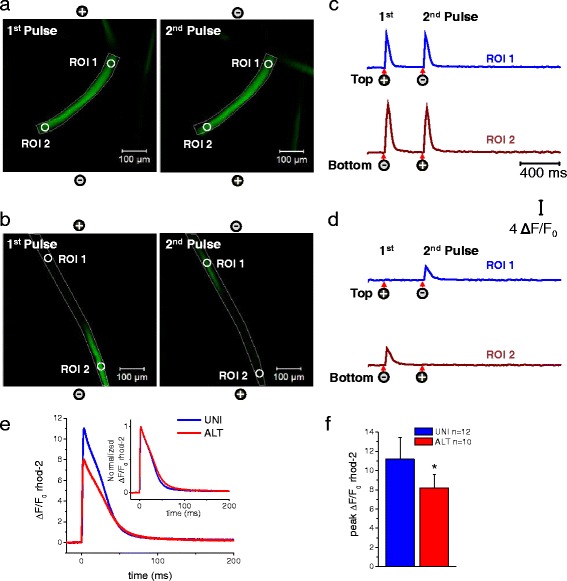
Fig. 1.

Electrically induced Ca2+ transients in myofibers exhibiting spatially uniform activation (UNI) or myofibers showing alternate end activation (ALT) in response to alternating polarity electric field stimulation. Spatio-temporal properties of depolarization-induced rhod-2 Ca2+ transients in myofibers that responded with uniform responses (a UNI) and myofibers showing local alternating end responses (b ALT) when stimulated with a bipolar field stimulation of alternating polarity and imaged in frame mode (xy-t; 60 frames/s) using high-speed confocal microscope. Images labeled as first and second in a and b represent snap shots of the time series at the peak of the transients in response to two sequential field pulses (0.5 ms; 15 V/cm) separated by an interval of 400 ms. See video in Additional file 3 for the entire time series. UNI myofibers exhibit a global Ca2+ transient in response to pulses of both polarities during alternating polarity stimulation, whereas ALT myofibers display only local non-propagated responses at alternating ends upon application of pulses of alternate polarity. The polarity signs indicate the location of the electrodes and their polarity for each stimulus. c and d are shown the time course of the rhod-2 fluorescence measured at the ends of the myofibers. Circles labeled as regions of interest (ROI) show ROI 1 (myofiber’s upper end, blue trace) and ROI 2 (myofiber’s lower end, dark red trace) show the locations used to measure the time course of the rhod-2 fluorescence. Arrows and signs under the traces indicate both the polarity and the time when the pulses where applied. Vertical scale: ΔF/F0 = 4; horizontal scale: time 400 ms. e Averaged time courses of the rhod-2 fluorescence measured in UNI myofibers and at the responding end of the ALT myofibers using ultra high-speed line scanning (100 μs/line) to further characterize the temporal properties of the Ca2+ transients. Inset, Time course of the normalized Ca2+ transients in the UNI and ALT myofibers derived from panel E to compare the kinetics of Ca2+ transients. f Bar plot summarizing differences in peak amplitude of rhod-2 ΔF/F0 transient. UNI fibers: ΔF/F0 = 11.18 ± 2.2, n = 12, N = 3; ALT fibers: ΔF/F0 = 8.15 ± 1.4, n = 10, N = 3. N indicates number of mice per condition, and n indicates number of fibers tested.*Indicates P < 0.05 when compared with UNI control fibers, two-sample t test
