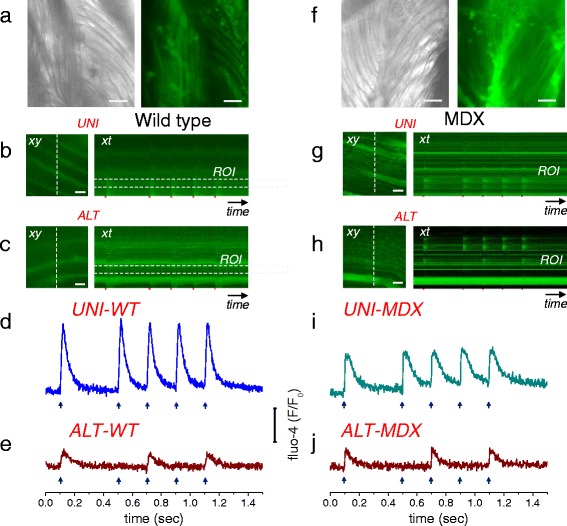
Fig. 8.

Alternate Ca2+ responses are observed in muscle fibers stimulated by bipolar field stimulation in whole muscle from wild-type and MDX mice. a Left panel, transmitted light image (×10 objective) of a segment of a FDB muscle isolated from wild-type mouse showing bundles of myofibers. Right panel, confocal image of the same FDB muscle segment shown on left panel, loaded fluo-4-AM. The whole muscle was explored in search of alternate responses using line-scan (xt) imaging (2 ms/line). b Representative confocal frame (xy, left panel) and line-scan images (xt, right panel) of a FDB segment illustrating uniform (UNI-WT) responses to a single field stimulus followed by a train of four pulses at 5 Hz. c representative frame (xy; left panel) and line-scan (xt; right panel) images of a FDB segment illustrating alternate (ALT-WT) responses to the same field stimulation pattern used in panel b. b, c were imaged with a × 63/1.5 NA objective. Trace in panel d shows time course of fluo-4 signals in the UNI-WT fiber (blue trace). Trace in panel e shows time course of fluo-4 signals of the ALT-WT fiber (red trace). f Left panel, transmitted light image (×10 objective) of a segment of a FDB muscle isolated from MDX mouse. Right panel, confocal image of FDB muscle segment, shown on left panel, loaded fluo-4-AM. g Exemplar confocal frame (xy, left panel) and line-scan images (xt, right panel) of a FDB segment from MDX mouse illustrating uniform (UNI-MDX) responses to field stimuli as used in panel b. h representative confocal frame (xy; left panel) and line-scan (xt; right panel) images of a FDB segment from MDX mouse illustrating alternate (ALT-MDX) responses to the same field stimulation pattern used in panel b. g, h were imaged with a × 10/0.3 NA objective. i shows time course of fluo-4 signals in the UNI-MDX fiber (cyan trace). j shows time course of fluo-4 signals of the ALT-MDX fiber (red trace). The dashed rectangles in b, c, g, and h (right panels) show regions of interest (ROI) used to measure the fluorescence time course. Note that the Ca2+ transients of the UNI-WT and UNI-MDX fibers (d and i) occur in response to each single stimulus (arrows under traces), whereas the ALT-WT and ALT-MDX fibers (e and j) respond to every other stimulus (see arrows under traces). Scale bars in a, f–h: 100 μm; b and c: 20 μm
