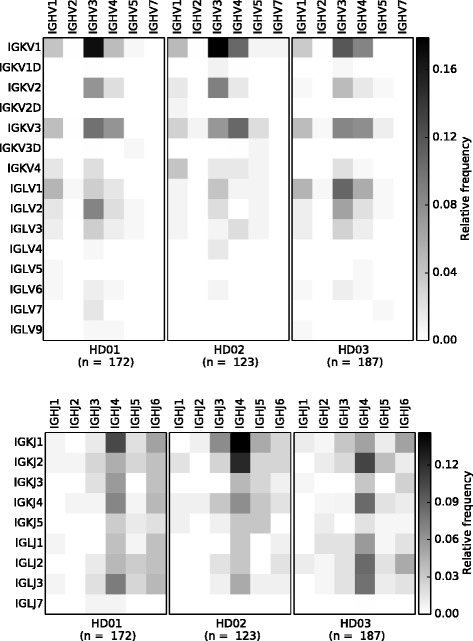
Fig. 2.

Paired Ig heavy and light chain segment usage. The analysis module of sciReptor comprises functions to plot the associations between heavy and light chain segments. The upper heatmaps represent relative association frequencies between heavy and light V segment families for each individual donor. The lower panel shows association frequencies of heavy and light J segment families
