
Fig. 2.
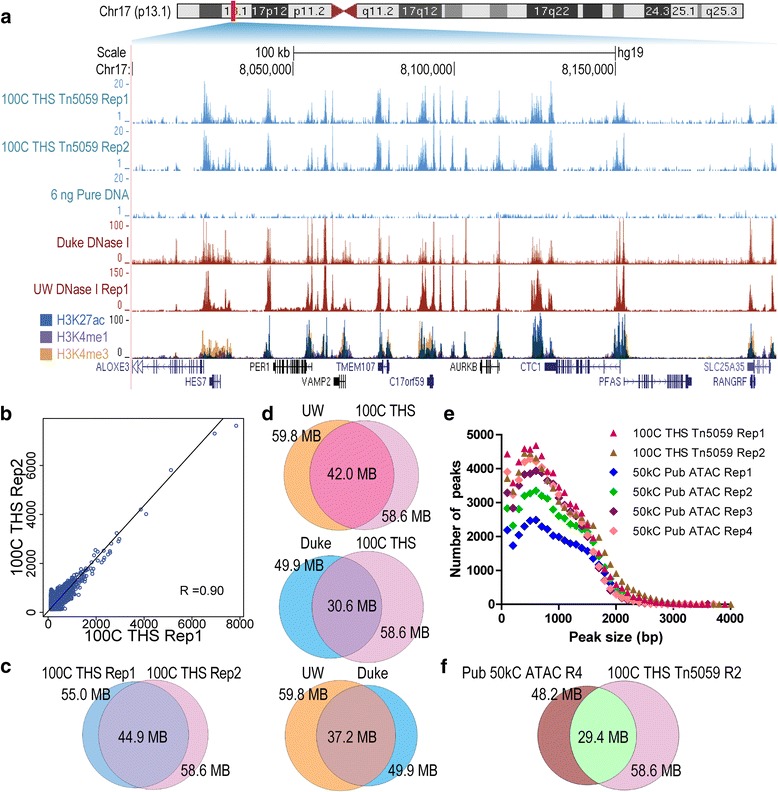
Validation of 100-cell THS-seq/Tn5059 data against ENCODE data and ATAC-seq data. a 200 kb view of accessible chromatin marks in GM12878 lymphoblastoid cells in 100-cell THS-seq/Tn5059 data, a purified DNA control, published ENCODE accessibility data from Duke and UW, and ENCODE histone modifications which are often found near regulatory elements and promoters. b Correlation of 100-cell THS-seq/Tn5059 replicate 1 data and 100-cell THS-seq/Tn5059 replicate 2 data. c Base pair overlap of 100-cell THS-seq/Tn5059 replicate 1 data and 100-cell THS-seq/Tn5059 replicate 2 data. d Base pair overlap between 100-cell THS-seq/Tn5059 replicate 2 data and ENCODE datasets, and ENCODE datasets base pair overlap among themselves. 100-cell THS-seq/Tn5059 replicate 2 data were used in ENCODE comparisons because they had the most base pairs in peaks called significant. e Peak size distributions between 100-cell THS-seq/Tn5059 datasets, and published 50,000-cell ATAC-seq datasets. f Base pair overlap between 100-cell THS-seq/Tn5059 and published 50,000-cell ATAC-seq replicate 4 data. Published 50,000-cell ATAC-seq replicate 4 data were used since they had the most base pairs called significant compared to the other published 50,000-cell ATAC-seq datasets