
Fig. 3.
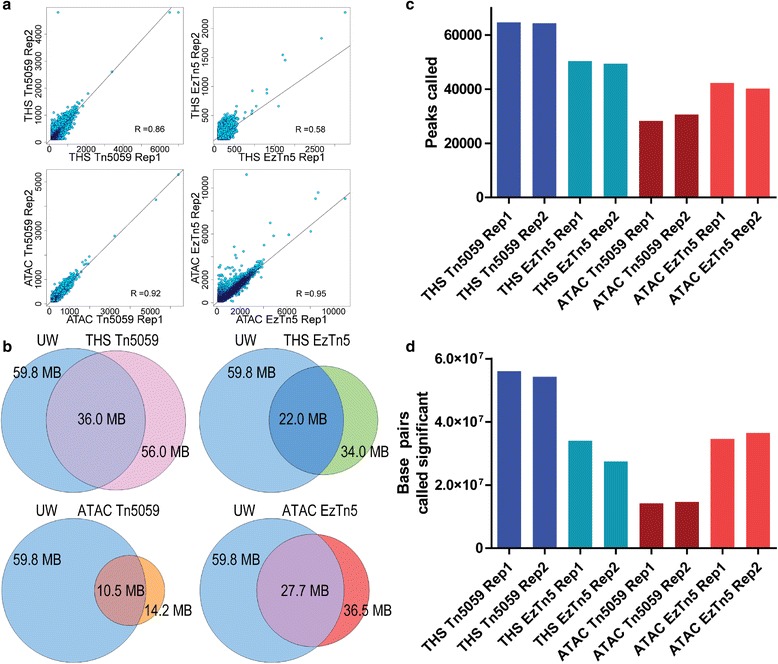
Comparison between THS-seq/Tn5059, THS-seq/EzTn5, ATAC-seq/Tn5059, and ATAC-seq/EzTn5 with 500 cells of input material. All datasets and replicates were down-sampled to 8,351,125 unique alignments before analysis. a Correlation between replicates for each experimental condition. b Base pair overlap of each experimental condition with UW data. The replicate with the most base pairs called significant was used in analysis and represented in each condition. UW data were chosen since they had the most base pairs called significant of the ENCODE datasets. c Total number of peaks called by Dfilter for each condition. d Total number of base pairs under peaks called significant by Dfilter