
Fig. 5.
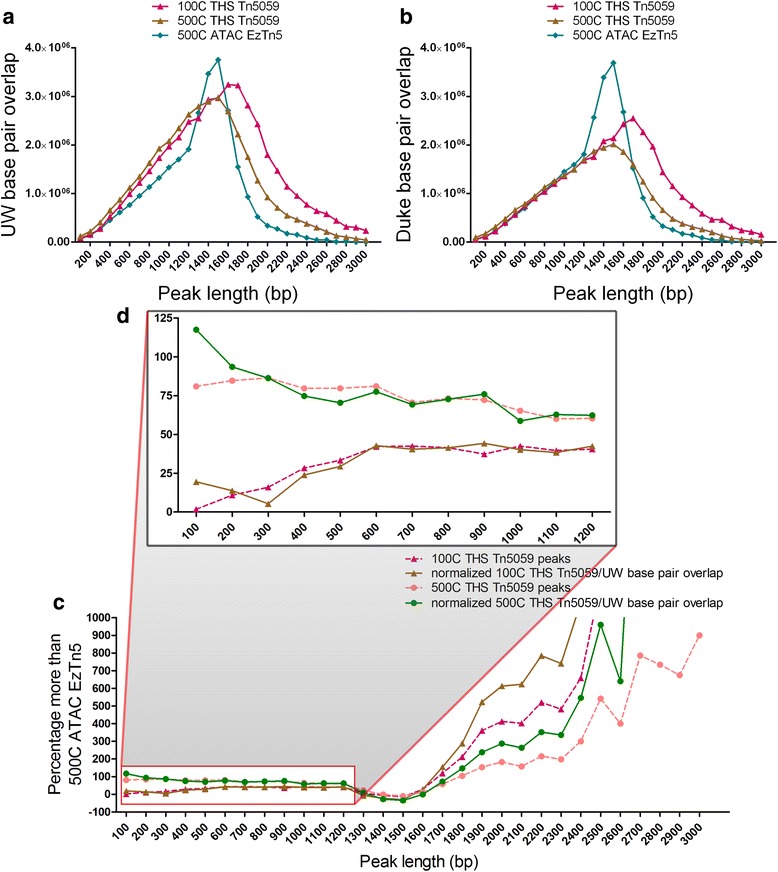
Validation of peaks based on peak length. a Base pair overlap with ENCODE UW data based on peak lengths for 100-cell and 500-cell THS-seq/Tn5059 data, and 500-cell ATAC-seq/EzTn5 data. b Base pair overlap with ENCODE Duke data based on peak lengths for 100-cell and 500-cell THS-seq/Tn5059 data, and 500-cell ATAC-seq/EzTn5 data. c The percentage more peaks found in 100-cell and 500-cell THS-seq/Tn5059 than in 500-cell ATAC-seq/EzTn5 data, and the percentage more normalized 100-cell and 500-cell THS-seq/Tn5059 and UW base pair overlap than in 500-cell ATAC-seq/EzTn5. Normalizing was performed using the global base pair overlap values for each ENCODE dataset. d Zoom in on graph (c) showing the peak lengths between 100-1,200 base pairs