Figure 2.

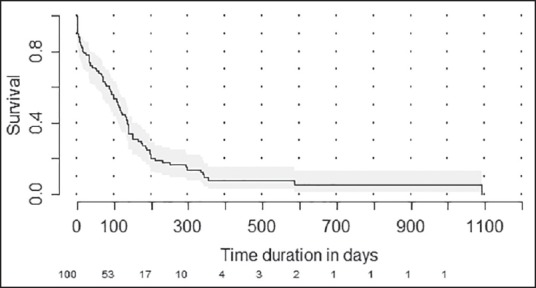
Kaplan-Meier plot showing estimated overall survival for the whole cohort. Numbers at risk are shown at the bottom of the graph

Kaplan-Meier plot showing estimated overall survival for the whole cohort. Numbers at risk are shown at the bottom of the graph