
Fig. 4.
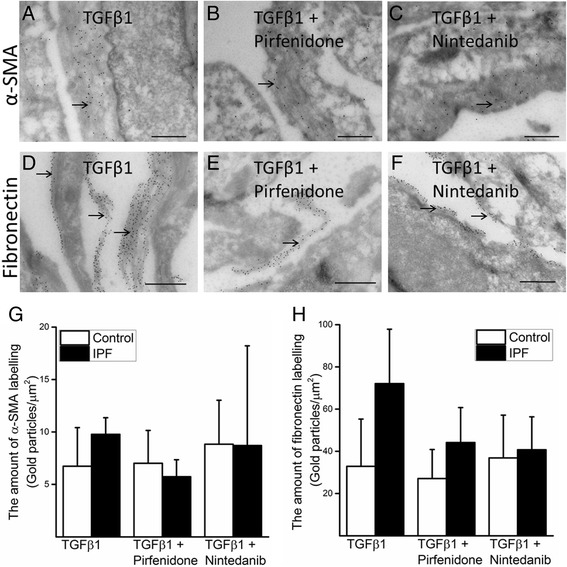
A representative of IEM of IPF derived cells (a-f) and quantification of α-SMA (g) and fibronectin (h). The cells were exposed to TGFβ1 (a, d), to TGFβ1 and pirfenidone (b, e) and to TGFβ1 and nintedanib (c, f). α-SMA (a-c) and fibronectin (d-f) expression can be localized by the presence of gold particles (black dots) by IEM. For evaluating the level of expression (g) and (h), the values of average numbers of gold particles in stromal cells derived from two control and two IPF lungs are shown. The concentrations used were 5 ng/ml TGFβ1, 0.5 mM pirfenidone and 0.5 μM nintedanib. Scale bar is 0.5 μm