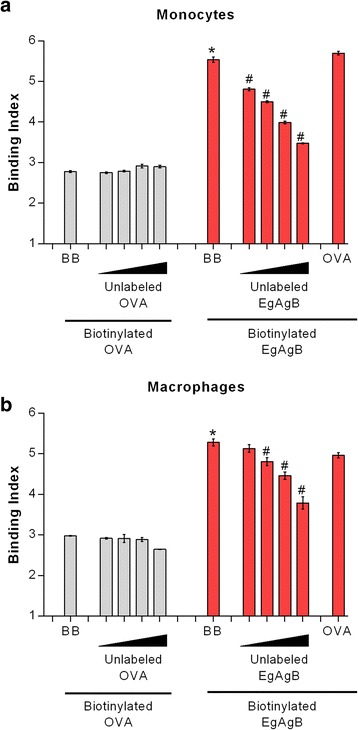
Fig. 3.

Competition binding assays for studying binding specificity. In these assays the binding of biotinylated EgAgB (in a fixed concentration 250 μg/ml) was competed out by the unlabelled lipoprotein (at concentrations between 125 and 1000 μg/ml) or OVA (1000 μg/ml) as a control (red bars). In parallel, similar competition assays were carried out using biotinylated OVA (grey bars). a Assays for THP-1 monocytes. b Assays for THP-1 macrophages. Results are expressed as binding index, and correspond to mean values ± SEM of triplicates. Asterisks (*) indicate significant differences with respect to the binding of biotinylated OVA used as a control, while number signs (#) indicate significant differences with respect to biotinylated EgAgB incubated in the absence of the unlabelled lipoprotein (one-way ANOVA followed by Tukey’s post-test, p < 0.05). One representative experiment of two is shown in each panel
