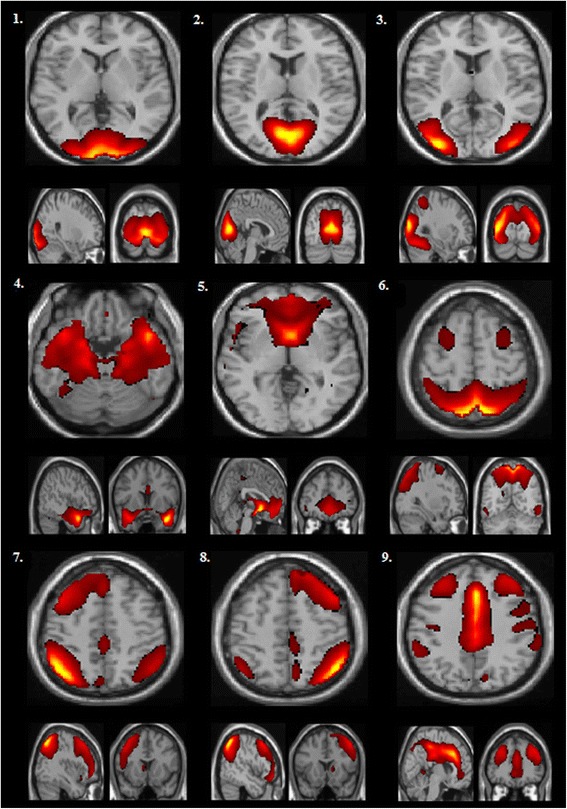
Fig. 1.

Group ICA was performed on a combined sample of patients and controls. This figure consists of a spatial map depicting (for the full sample) the nine components that subsequently displayed significant group differences in functional connectivity in our full factorial analysis (Bonferroni correction (p ≤ 0.002): (1) a high-level visual processing network (HLVPN); (2) a low-level visual processing network (LLVPN); (3) a visual/precuneus network; (4) a limbic network (LN); (5) a default-mode network (DMN); (6) a visual spatial processing network (VSPN); (7) a left frontal-parietal network (LFPN); (8) a right frontal-parietal network (RFPN); and (9) a self-referential network (SN)
