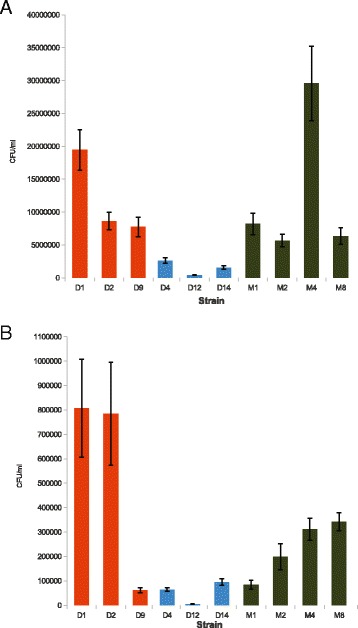
Fig. 2.

Association and invasion assays. Error bars represent +/-1SEM, bars are coloured based on phylogenetic membership, L1 (orange), L2 (blue) and S. Mbandaka (green). a Association: There was no lineage or serovar level trend for association to IPEC-J2 assays after 30 min of incubation at 37 °C. S. Mbandaka M4 associated in significantly greater numbers to the monolayer then all other isolates (p < 0.05). b Invasion: S. Derby L1 isolates D1 and D2 invaded in significantly greater numbers (p < 0.05) then all other isolates. S. Derby L2 and L1 isolate D9 invaded significantly fewer numbers than S. Mbandaka and lineage 1 isolates
