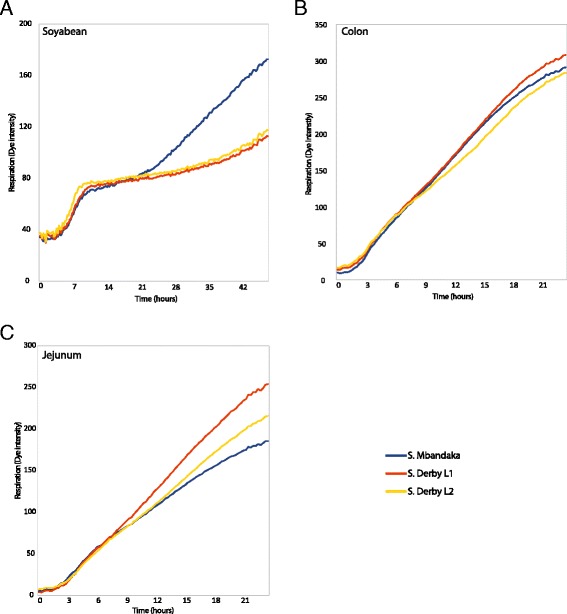
Fig. 3.

Respiratory dynamics measured through reduction of a tetrazolium dye. All values represent the averaging of 9 replicates of each isolate across a group; L1 (D1, D2, D3, D5, D6, D7, D10, D11 and D13), L2 (D4, D12 and D14) and S. Mbandaka. a All strains respired on soybean homogenate, though after a period of stationary respiratory dynamics, S. Mbandaka isolates underwent a second period of respiration. b There was no significant difference between dye intensity values of the three lineages on jejunum homogenate over the 24 h incubation period at 37 °C. c The dye intensity for S. Derby L1 was significantly different (p < 0.05) from that of L2 and S. Mbandaka after 13.5 and 10 h respectively, when incubated at 37 °C
