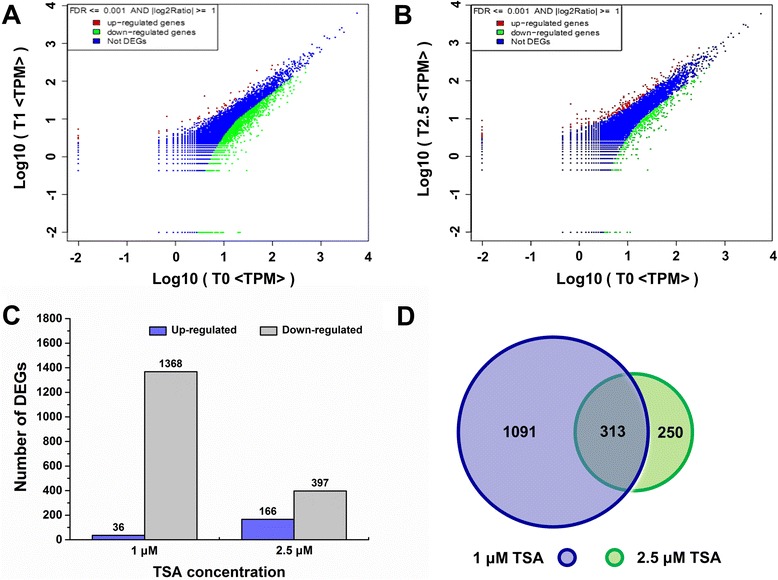
Fig. 6.

Differential expression analysis of unigenes by DGE. The expression level for each unigene in roots after growth on medium supplemented with TSA is shown in the volcano plots (a) and (b). The “x” axis represents the log10 of transcripts per million of the control (0 μM TSA treatment) and the “y” axis represents the log10 of transcripts per million of samples treated by 1 μM TSA (a) and 2.5 μM TSA (b). The red dots indicate the abundance of transcripts higher than two folds and green dots indicate transcripts lower than two folds in T1 and T2.5 libraries in comparison with T0 library. FDR ≤ 0.001 and the absolute value of log2Ratio ≥ 1 were used as the threshold to judge the significance of gene expression difference. The number of up-regulated and down-regulated unigenes in roots after TSA treatments (c) and the common differentially expressed genes after 1 μM TSA and 2.5 μM TSA treatments (d) were summarized
