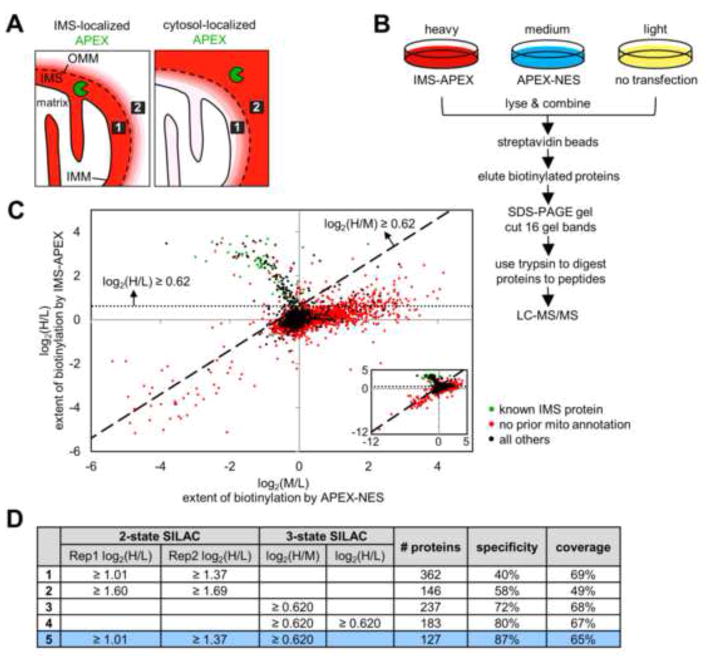
Figure 2.
Ratiometric APEX tagging strategy improves spatial specificity and produces a high quality IMS proteome. (A) Because the OMM is permeable to molecules <5 kDa, including the biotin-phenoxyl radical, some cytosolic proteins will be tagged by IMS-APEX. However, it is possible to distinguish IMS proteins (e.g., protein 1, represented by the black box) from cytosolic proteins (e.g., protein 2) by comparing each protein’s extent of biotinylation by IMS-APEX (left) versus cytosolic APEX (APEX-NES) (right). For example, protein 1 should be more strongly biotinylated by IMS-APEX than by APEX-NES, regardless of its steric accessibility or surface tyrosine count. Conversely, protein 2 should be tagged more extensively by APEX-NES than by IMS-APEX. Red coloring represents endogenous proteins biotinylated by APEX. (B) 3-State SILAC experimental setup. Three HEK 293T cultures were treated identically with biotin-phenol and H2O2 for 1 minute, but the heavy culture expressed IMS-APEX, the medium culture expressed APEX-NES, and the light culture was untransfected. After labeling, the three lysate samples were combined and processed together as shown. For each protein, the H/L SILAC ratio reflects the extent of its biotinylation by IMS-APEX. The M/L SILAC ratio reflects the extent of its biotinylation by APEX-NES. The H/M SILAC ratio reflects the ratio of that protein’s biotinylation by IMS-APEX versus APEX-NES. (C) Scatter plot showing H/L ratio plotted against M/L ratio for 99.96% of the 4,868 proteins identified by MS (inset shows all proteins, including the few with very low SILAC ratios). Proteins previously known to be IMS-exposed are colored green in the plot (i.e., true positives, defined as members of our “IMS gold+ list” (tab 1 of Table S2)). Proteins without previous mitochondrial annotation are colored red (false positives). SILAC cut-offs used in row 4 of (D) are shown by the dashed lines. See “Scatter plot analysis” in the Supplemental Experimental Procedures and tab 5 of Table S1 for details. (D) Table showing IMS proteome size, specificity, and coverage derived from different datasets and different SILAC cut-offs (truncated to three significant figures). Specificity refers to mitochondrial specificity, i.e. the percentage of the proteome that has mitochondrial annotation in GOCC (Ashburner et al., 2000), Mitocarta (Pagliarini et al., 2008), our previous mitochondrial matrix proteome (Rhee et al., 2013), or the literature. Coverage refers to the percentage of our IMS gold+ list (tab 1 of Table S2) that is detected in the proteome. Condition 5 (bottom row, colored blue) was used to obtain the final IMS proteome (shown in tab 1 of Table S1). Rep1 and Rep2 are the two different replicates of the 2-state SILAC experiment described in Figure S2A.

