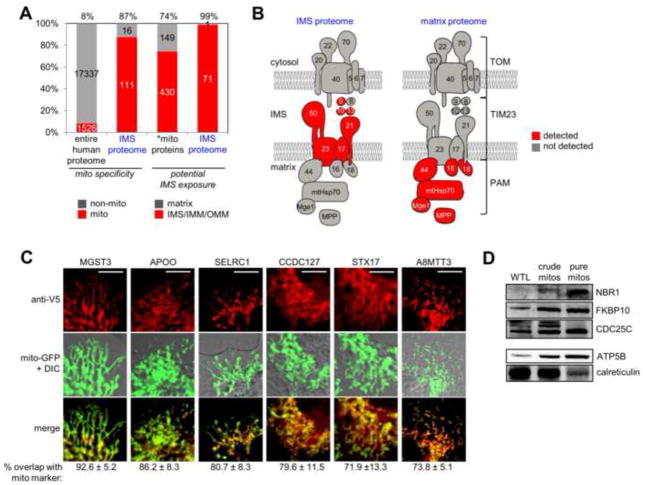
Figure 3.
Characterization of IMS proteome specificity. (A) Bar graph showing the enrichment of mitochondrial proteins as well as IMS proteins in the IMS proteome. The first two columns show the percentage of proteins, in the entire human proteome and in the IMS proteome, respectively, with prior mitochondrial annotation. The second two columns show the percentage of proteins with potential IMS exposure (IMS, IMM, or OMM annotation). *mito proteins refers to the 579 mitochondrial proteins with annotated sub-mitochondrial localization. See tab 4 of Table S2 for details. (B) Subunits of the TOM/TIM/PAM mitochondrial protein import complex (Gebert et al., 2011) detected in the IMS proteome (left) and in our previous mitochondrial matrix proteome (right) (Rhee et al., 2013). See tab 5 of Table S2 for details. (C) Imaging analysis of six mitochondrial orphans identified in this study. After transient transfection, proteins were detected by anti-V5 staining in COS-7 cells, and compared to a mitochondrial GFP marker. Regions of overlap are colored yellow in the “merge” row. Quantitation of overlap from ≥10 cells for each protein is given beneath each image set. A positive control construct (IMS-APEX) gave 89.3% ± 6.3% mitochondrial overlap, while negative control constructs (P4HB-V5 and APEX-NES) gave 40.3% ± 9.9% and 27.0% ± 9.0% mitochondrial overlap, respectively (data not shown). Scale bars, 10 μm. Note that imaging experiments for individual orphans were performed separately, rather than in parallel, but are shown together here. (D) Western blot detection of three mitochondrial orphans identified in this study, in purified mouse liver mitochondria. WTL is whole tissue lysate. Protein molecular weights are 110 kD (NBR1), 65 kD (FKBP10), and 50 kD (CDC25C). Control blots are shown for a mitochondrial matrix marker (ATP5B, 51 kD), which becomes enriched as mitochondrial purity increases, and an ER marker (calreticulin, 48 kD), which becomes de-enriched.

