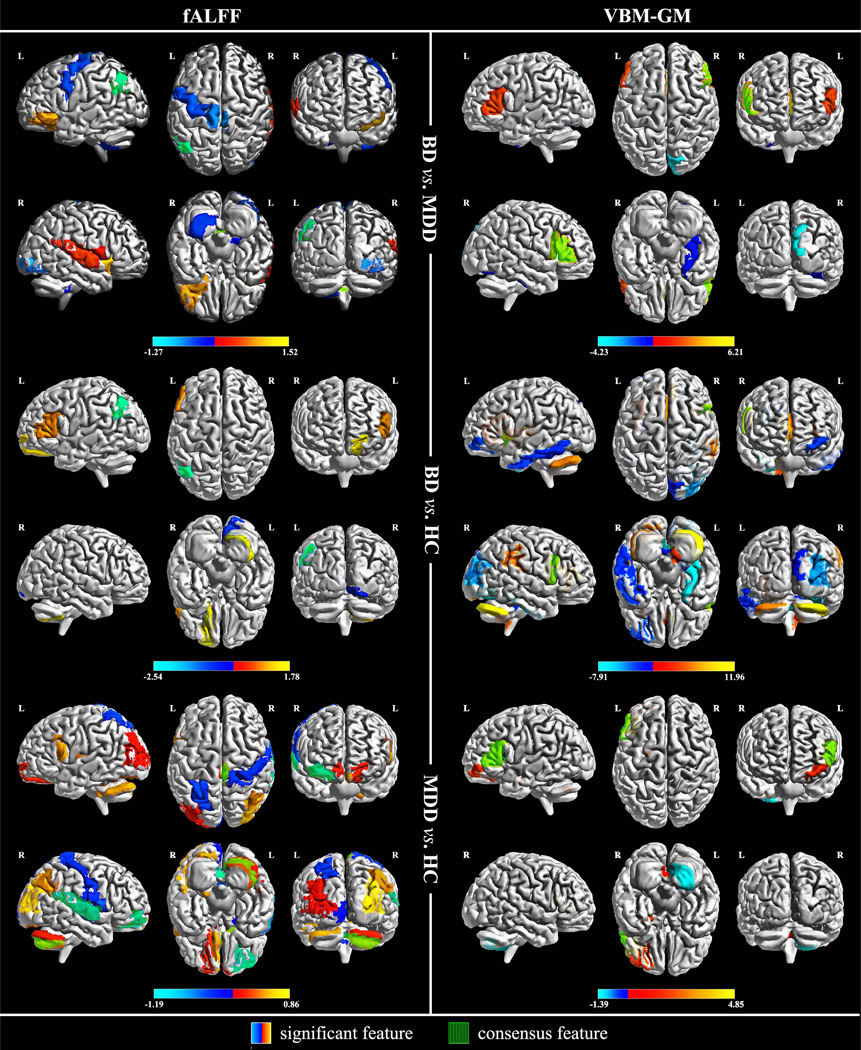
Fig. 2.
Visualization of the significant features. Weight values were assigned to their corresponding AAL brain areas as mapped in color bar. The fALFF modality data are in the left column, whilst the VBM-GM modality is on the right. From top to bottom, classification conditions are arranged in this order: BP vs. UP, BP vs. HC, UP vs. HC. Consensus features are displayed with vertical green stripes overlapped on original color mapping of the significant features (see terms with black dot shown in TABLE IV).

