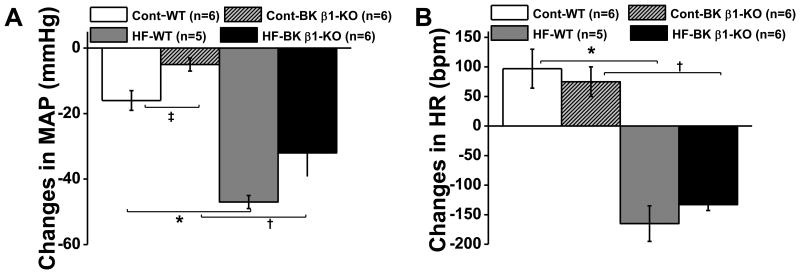
Figure 3.
Hexamethonium (HEX, i.p) induced peak changes in MAP (A) and HR (B) in 24 week control and HF fed mice. MAP and HR were sampled continuously for 10 seconds every 10 minutes before and up to 120 minutes after injection. Peak changes were recorded at 20 minutes post-injection. Data are presented as mean ± SE. *P<0.05, HF-WT vs control WT; †P<0.05, HF-BK β1-KO vs control BK β1-KO; ‡P<0.05, control WT vs control BK β1-KO.

