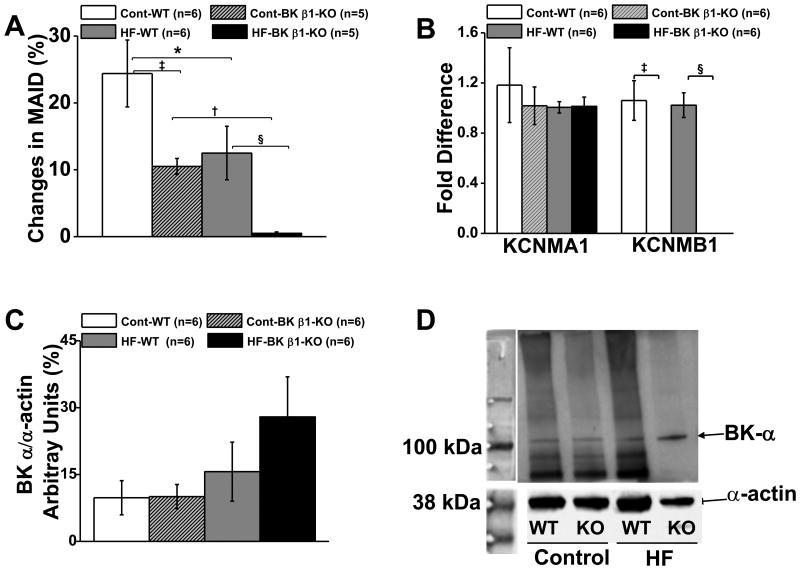
Figure 6.
A. Comparison of paxilline induced contractions in 24 week diet fed control and HF MA. B. Expression of BK α- and β1-subunt mRNA levels in control and HF MA. KCNMA1, gene code of BK α-subunit; KCNMB1, gene code of BK β1-subunit. C. Expression of BK α-subunit protein levels in control and HF MA. D. BK α-subunit blots from control and HF MA. Data are presented as mean ± SE. *P<0.05 HF-WT MA vs control WT MA; †P<0.05 HF BK β1-KO MA vs control BK β1-KO MA; ‡P<0.05 control WT MA vs control BK β1-KO MA; §P<0.05, HF-WT MA vs HF-BK β1-KO MA.

