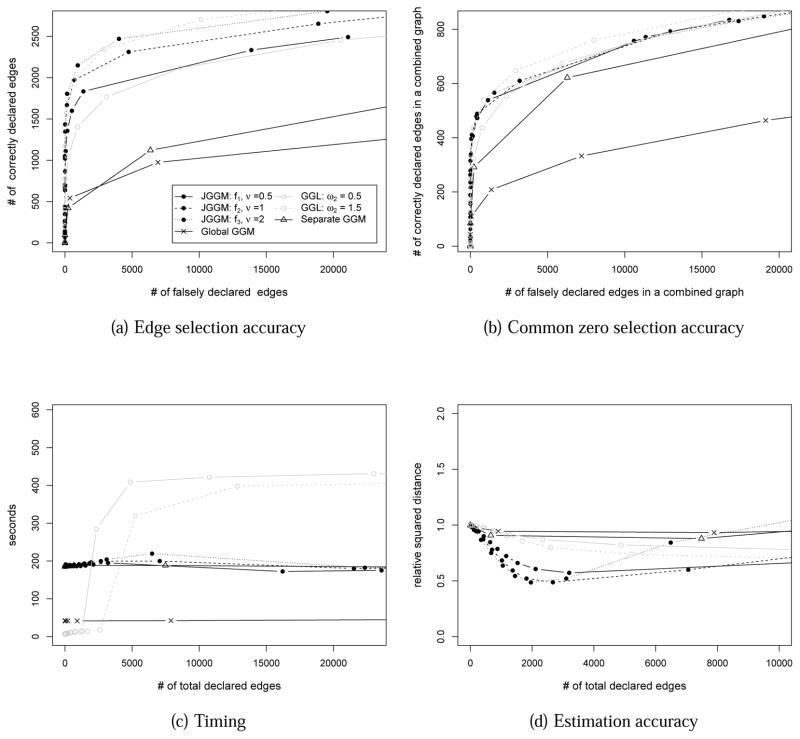
Figure 1.
Performance comparison on simulated data of nt = 150, p = 500 and T = 5. The performances of joint sparsity GGMs (JGGM) with f1, ν = 0.5; f2, ν = 1; and f3, ν = 2 are compared to the performances of the single global GGM approach and the separate GGM approaches, as well as group graphical lasso (GGL) (Danaher et al., 2012) with ω2 = 0.5 and ω2 = 1. (a): The number of correctly declared edges is plotted against the number of falsely declared edges. (b): The number of correctly declared edges in a combined graph is plotted against the number of falsely declared edges in a combined graph. (c): Running time (in seconds) is plotted against the number of total declared edges. (d): The relative squared distance (RSD) of the estimated models from the true models is plotted.

