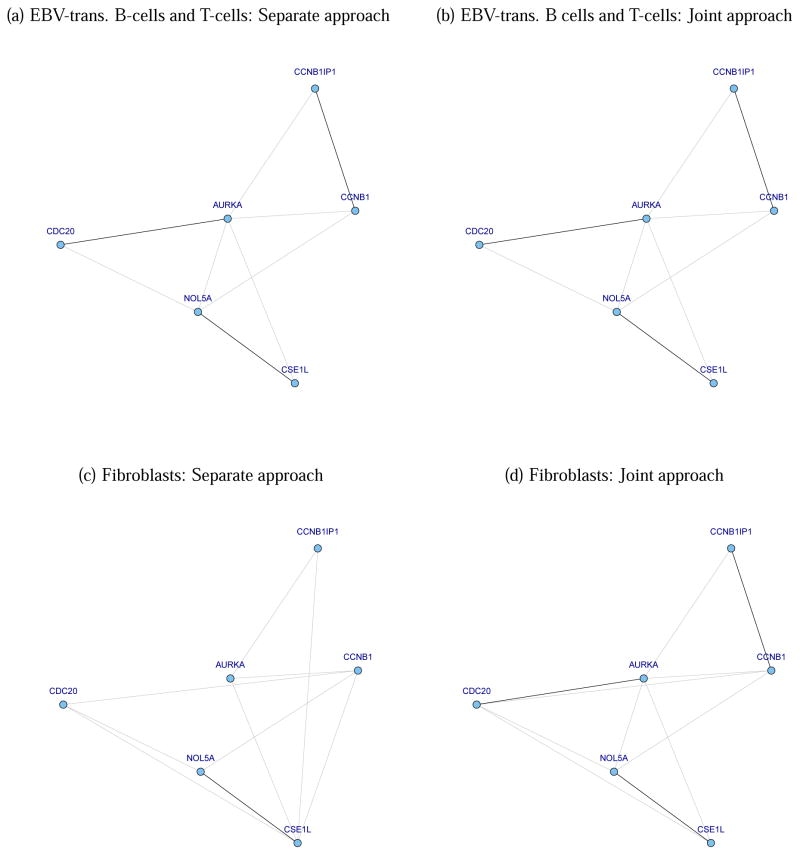
Figure 2.
The estimated GGMs for Embryonic Stem Cell pathway
Edges from the separate approach and joint approach (f2, ν = 1) are depicted with gray lines, and the edges that match with the KEGG database are colored with black. The graphs of the EBV-transformed B-cells and T-cells are the same in both separate and joint approaches, but that of the fibroblasts has few more edges, which is consistent with the fact that the B-cells and T-cells are more similar to each other.

