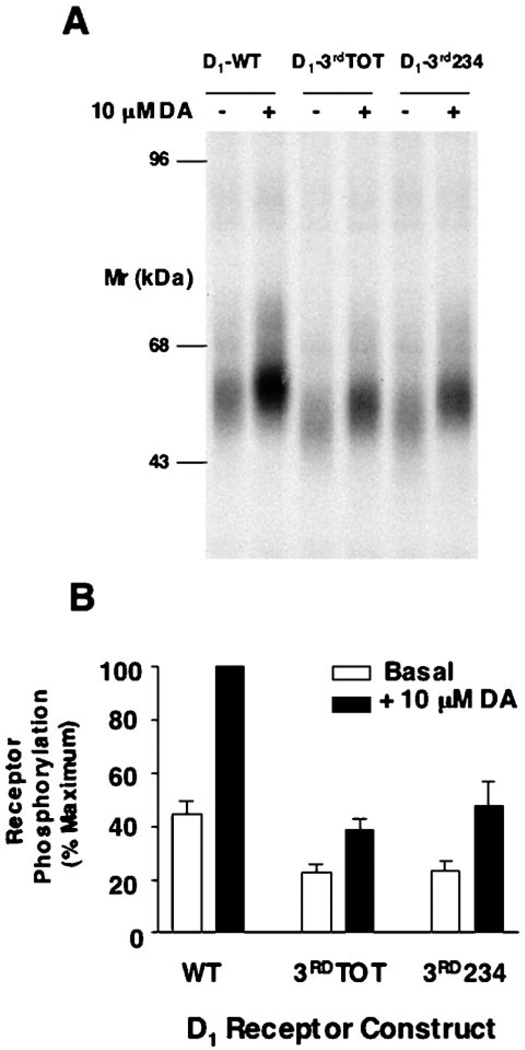
Fig. 5. Agonist-induced phosphorylation of the WT and 3rd loop mutant D1 receptors.
A, autoradiogram of SDS-PAGE analysis of immunoprecipitates from whole cell phosphorylation assays. HEK293T cells were transiently transfected with the WT and 3rdTOT and 3rd234 receptor constructs, pre-labeled with [32P]H3PO4, and treated with vehicle (basal) or 10 µm dopamine (DA) for 10 min. Samples were then subjected to immunoprecipitation as described under “Experimental Procedures” and resolved by 8% SDS-PAGE. Receptors were quantified, and equal amounts of receptor protein were loaded into each gel lane as described under “Experimental Procedures.” A representative experiment is shown. B, the receptor phosphorylation was quantified by scanning the autographs followed by analysis with the software package NIH Image. Data are the mean values (±S.E.) of band density (arbitrary units) from 3 independent experiments and are presented as a percentage of the maximum phosphorylation observed (WT + 10 µm dopamine).

