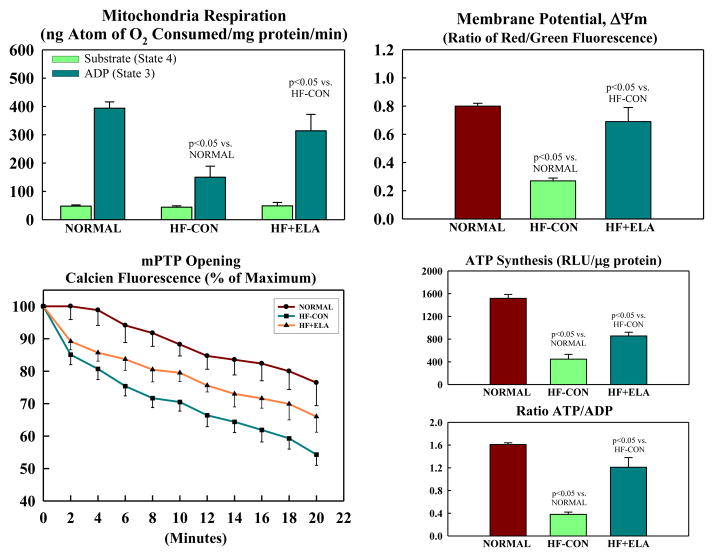
Figure 3.
Mitochondrial function in cardiomyocytes of left ventricular myocardium of normal dogs, untreated heart failure control dogs (HF-CON) and dogs with heart failure treated with elamipretide (HF+ELA). Top Left: Mitochondrial state 3 and 4 respiration. Top Right: Mitochondrial membrane potential. Bottom Left: Mitochondrial permeability transition pore (mPTP). Bottom Right: Maximum rate of adenosine triphosphate (ATP) synthesis and ratio of ATP to adenosine diphosphate (ADP). Probability values are comparisons between normal dogs, HF-CON and HF-ELA dogs. Statistical significance based on one way ANOVA followed by the Student-Neuman-Keuls. All bar graphs are depicted as Mean±SEM.

