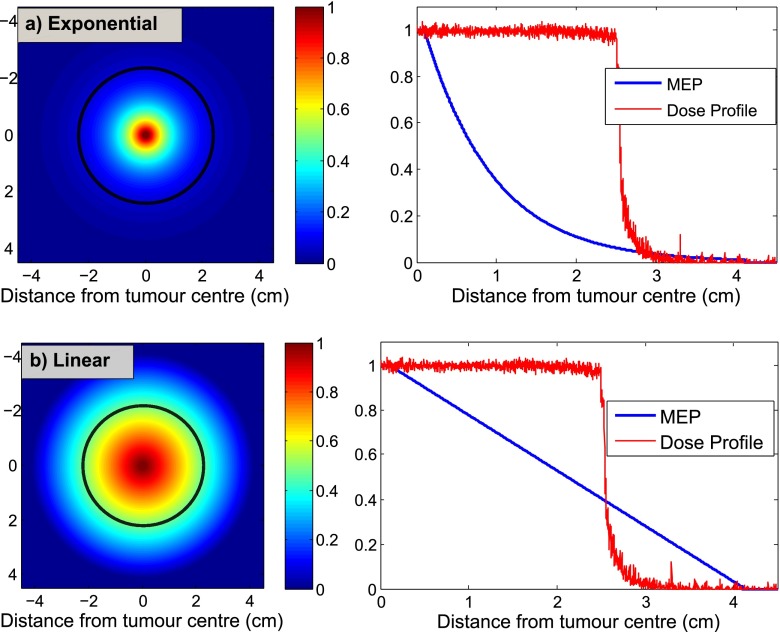
Figure 4.
Microscopic extension probability (MEP) models representing the probability that a cell is a clonogen based on the distance from the gross tumour volume: (a) exponential, (b) linear. The black contours, superimposed on MEP illustrations, represent the beam regions (i.e. planning target volume = 2.5 cm) related to a 2.0-cm clinical target volume margin receiving ≥90% dose.

